

Review of 2021
In 2021, the sporting goods industry experienced impressive market growth with a strong consumer shift to e-commerce, displaying an increase of 39% since Q4’ 2019 (Digital Commerce 360). The athleisure and sportswear subcategories were the top movers driven by the majority of people working from home due to the pandemic. We also witnessed consumers reach new levels of health awareness and shift buying patterns to adopt healthier lifestyle choices. This led to a surge in demand for the fitness and exercise, golf, and outdoor categories.
However, the 2021 fiscal year was not entirely ideal. Brands and retailers have and continue to experience ongoing supply chain disruptions impacting the flow of goods. Stimulus spending and the pandemic led to an increase in consumer demand for goods. In turn, this yielded record-high import volumes causing port capacity, warehousing capacity, and labor constraints. The domino effect did not stop there – disruptions continue to cause ripple effects downstream in the supply chain.
Outlook for 2022
In 2022, we expect the sporting goods industry to experience tailwinds from digital and athleisure, exercise equipment, sportswear category growth. With federal and state lockdowns and mask mandates lifted, we also expect consumers to continue to participate in more outdoor activities such as golf, team sports, hiking, and biking.
For the reasons mentioned above, our outlook for the sporting goods industry is positive. However, the rise in fuel and freight costs, falling consumer sentiment, and uncertain economic landscape leave the industry at a crossroads. In late 2021, many retailers and brands moved from just-in-time (JIT) to just-in-case (JIC) inventory models in efforts to keep up with consumer demand.
In Q1’ 2022, there are strong signs indicating that consumer demand has tapered and now both retailers and brands have what many have named as ‘inventory bloat’. All signs are pointing toward a widespread bullwhip effect. This is forcing major retailers like Target to slash prices on select durable goods and redistribute raw materials meant for some goods to products with higher demand.
“Retail inventories are elevated,” Michael Fiddelke, Target’s Chief Financial Officer, told The Associated Press in a phone interview. ”And they certainly are for us, in some of the categories that we misforecast. We determined that acting aggressively was the right way to continue to fuel the business.” (NBC)
From a SMB and mid-market perspective, we’ve seen a considerable uptick in the amount of third-party warehousing requests for inventory overflow. However, available warehouse capacity is at an all- time-low and WarehouseQuote’s recently published Warehouse Pricing Index suggests that this limited capacity and industry wide labor challenges are placing upward pressure on warehousing costs.
United States warehouse vacancy rates have reached a 40-year low at 2.9 percent and are even scarcer in port markets.
In this report, we’ve provided a macroeconomic outlook on the state of the sporting goods industry with a focus on the logistics and supply chain.
A glance at the sporting goods industry
The global sporting goods and equipment market size is valued at $126 billion, with the U.S. making up 32.5 percent of total market share. In 2021, U.S sporting goods store sales reached $52.9 billion. The sector experienced 14 percent year-over-year growth (2021 vs 2020) globally and 15 percent in the United States market. Through 2025, the sporting goods sector is expected to grow 8-10 percent,
annually.
Sporting goods market growth
- 14 percent year-over-year growth annually
- 15 percent year-over-year growth in the US annually
- 8-10 percent expected annual growth rate through 2025
Industry trends
- The digital shift
- The emergence of social commerce
- The rise of health awareness
- Ongoing supply chain disruptions
Macroeconomic research
Retail sales 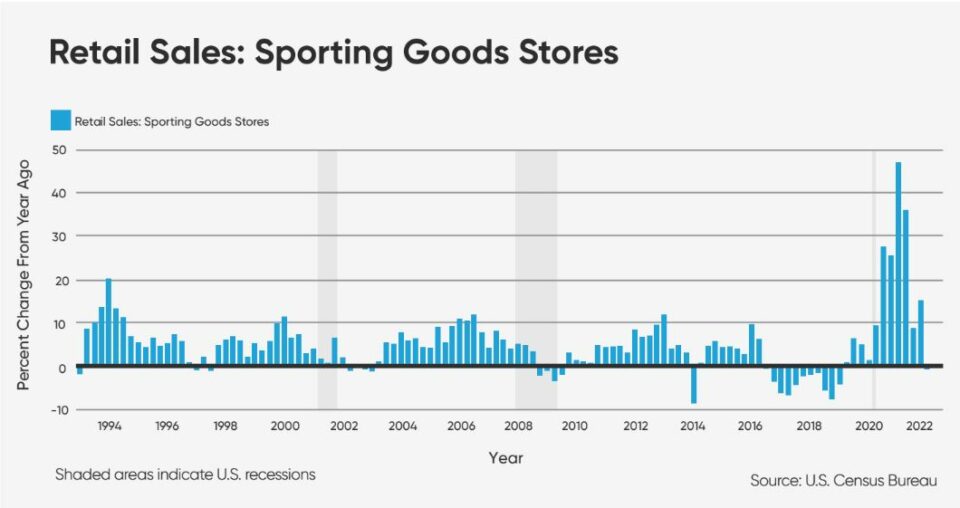

Sporting goods retail sales have soared since the start of the pandemic. From Q1’ 20 to Q1’ 21, retail sales increased 47 percent and 24 percent in the 2021 fiscal year. Signs of tapered consumer demand and spending are shown in theQ1 ‘22 retail sales numbers with (+/- 0 percent year-over-year change).
Top sporting goods retailer, Dick’s Sporting Goods, cited that it has a ‘cautious’ outlook for the year based on 40-year high inflation rates and uncertain economic conditions. The retailer also believes the pandemic surge in outdoor activities isn’t going anywhere (CNBC).
“They are running. They are walking, they are playing golf,” Hobart said. “The pandemic surging categories that we’ve all been talking about…we believe they all have long-term growth potential.” – Lauren Hobart, Chief Executive Officer of Dick’s Sporting Goods
Producer price index
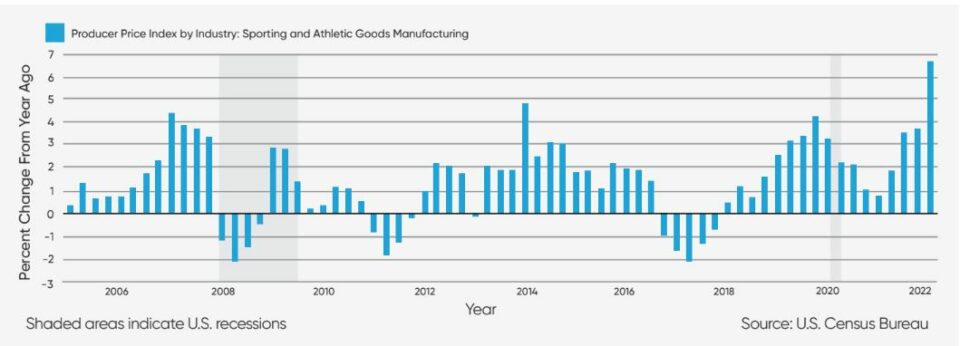
As sporting goods retail sales have risen, so have prices. Rising variable costs such as fuel and freight costs and inflation are a few of the major factors contributing to the 6 percent year-over-year price increase (FRED). We expect these rising variable costs to persist throughout 2022 into 2023.
It’s also important to note that vast majority of sporting and athletic goods manufacturing resides in China and Taiwan. Inventory is then exported to the United States West Coast via ocean freight. As mentioned above, the price to import goods into the United States has increased considerably. Over the last 18-24 months, we’ve seen the pandemic, container shortages, and port capacity constraints drive up ocean freight costs to unprecedented levels.
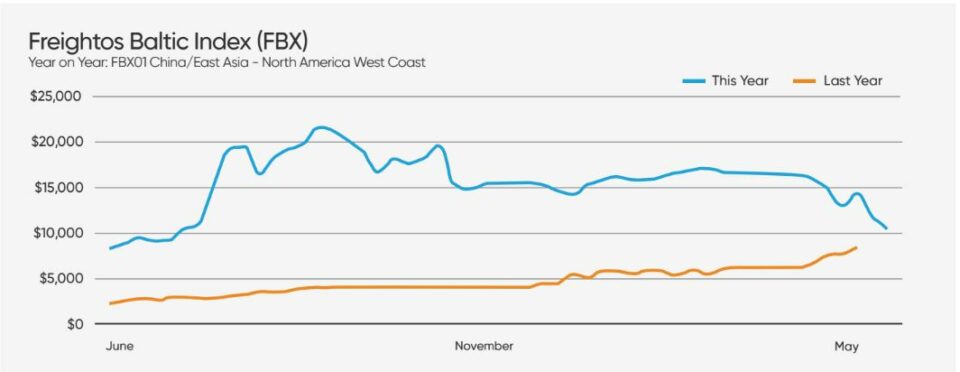
Prior to the pandemic, the average cost to ship a 40’ ocean container from China/East Asia was $1,500 on average (WSJ). During peak pandemic levels 40’ ocean container rates exceeded $21,000. Today, ocean freight rates from China/East Asia to the U.S. West Coast remained elevated at ~$10,000 per ‘40 container.
National average gas prices
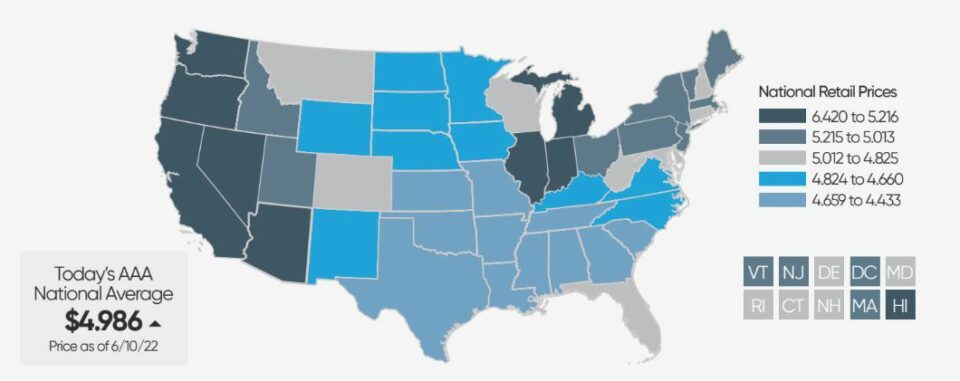
As of June 13th, national gas prices neared $5 a gallon. The United State west coast states like California reached $6.42 a gallon on average. The rising fuel prices are one of the major factors driving up LTL and FTL freight transportation costs and sporting goods producer pricing.
Consumer price index
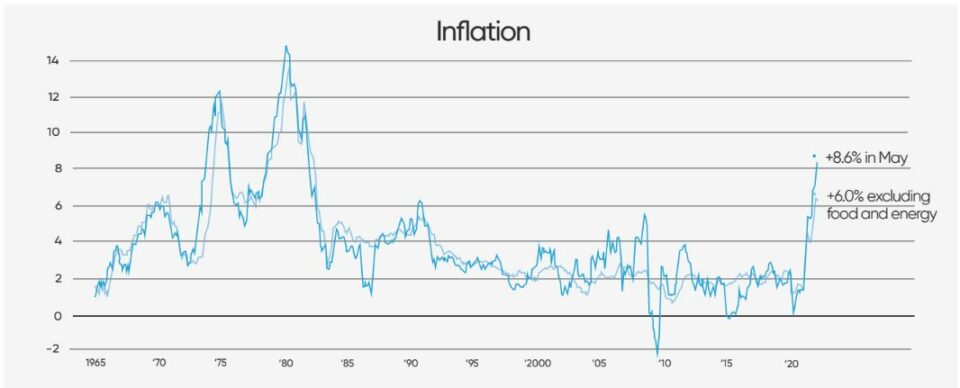
The figure shows the year-over-year percent change in the consumer price index (Source Bureau of Labor Statistics and The New York Times) The consumer price index of all items increased to 8.6 percent for the year ended May 2022. This marks the largest 12-month increase since December 1981 (BLS).
Mitigate risk from rising variable costs through last-mile optimization
Sporting goods brands have had little control over the rising freight, labor, fuel costs and the 40-year-high inflationary rates. This led to unexpectedly low profit margins and the choice between inventory shrinkage or passing off increased costs to the end consumer.
These challenges are forcing supply chain executives to get creative in an effort to produce unique opportunities that will reduce costs and increase customer satisfaction. Many of these executives are looking to find the solution to these challenges at the last-mile.
The last-mile refers to the “final leg” of the supply chain.
How WarehouseQuote is helping sporting goods brands find success at the last mile
WarehouseQuote is helping sporting goods brands design distributed warehouse networks redrive cost savings by leveraging the intelligence gathered from analyzing years of sales and transaction data.
Unlike traditional warehousing providers, our network is not locked-in, nor confined to specific geographical locations. It’s composed of hybrid warehouse network helping businesses navigate even the most difficult supply chain conditions with efficiency and ease.
Coupled with managed operations and our integrated technology platform, we provide middle market businesses with networkwide visibility, inventory and order management capabilities, and near-real-time KPI tracking.
Sources
• 2022: Mckinsey Sporting Goods and Equipment
• Sporting Goods Market Size and Growth
• Market Research: US Bicycle, Golf, Wearable Fitness Trackers, Tennis, Camping Goods, Skiing, Sporting Fishing, Snowboards,
and Skateboards
• Deloitte: 2022 Sports Industry Outlook
• World Federation Of the Sporting Goods Industry