Consumer demand drops. Inventories fall. Warehouse prices flatline. Tides calm. Learn about latest trends across the supply chain from WarehouseQuote, C.H. Robinson, S&P Global Market Intelligence, and Steam Logistics.
Jacob Roseburrough Director of Marketing
Executive Summary
4.3 percentincrease in the national average of warehouse storage costs year-over-year Q3’22 vs Q3’23, with stagnant quarter-over-quarter cost growth
The Midwest and West regions lead U.S regions with 9.6 and 6.5 percent increases from Q3’22 to Q3’23
U.S. retail inventory-to-sales ratios return to pre-pandemic levels in select sectors, with furniture, home appliances, and electronics stores standing at 1.59x in July 2023 compared to 1.58x average in 2016 to 2019
The average cost of drayage has dropped 20 percent since May 2023
The Warehouse Pricing Index is now available in Journal of Commerce’s extensive, multi-channel dashboard, Gateway. Learn more about the Gateway and how WarehouseQuote is helping supply chain managers make confident supply chain decisions.
State of 3PL warehousing: Available capacity expands but rates remain elevated
Consumer demand drops. Inventories fall. Warehouse prices flatline. Tides calm. The four busiest U.S. ports have experienced 20+ percent declines in the first 8 months of 2023. The cost to ship a 40 ft container from China/East Asia to North America West Coast is now less than $1,500. Manufacturing new orders are still down, representing the 13th consecutive month of contraction.
The year 2023 has largely been one of supply chain normalization and comes as much needed relief for logistics and supply chain managers. Larger retailers like Nike have made substantial progress on driving down inventories and controlling costs. However, it appears that small-to-medium-sized businesses still have all eyes on driving inventory efficiency.
The U.S. sales to inventory ratios provide visibility into the amount of time needed for manufacturing, retail, and wholesale companies to clear current inventory, in months. This ratio has remained flat over the last few months – indicating that businesses are still facing an uphill battle to clear out inventories sitting in storage at the warehouse.
Big-box retailers like Walmart, Target, and Home Depot continue to voice their concerns on the pullback of consumer spending as we continue into the retail peak season.
As inventories sit, businesses that utilize third-party warehouses rack up elevated inventory storage invoices. A line item that has become an eyesore for businesses. According to JLL, 33 percent of all U.S. industrial leases expiring in the next 24 months (~10,000 transactions). With a significant amount of industrial leases expiring coupled with tremendous industrial real estate rent growth rate over the last five years, the cost to store inventory in third-party warehouses will only become more expensive.
Over the next year, WarehouseQuote expects businesses to continue to focus on inventory efficiency with targeted inventory strategies. Thus, leading to a slow recovery of freight markets and a rise in the availability of 3PL warehouse capacity in 2024.
6 inventory strategies your business should consider to drive cost efficiencies in 2024
Conduct a SKU rationalization analysis to identify slow turning inventory and create action plans to deplete inventory and/or discontinue the SKU
Run a distributed inventory analysis to position inventory in ideal locations to find transportation savings
Review inventory turns to identify idle cargo accumulating storage fees, then dispose of cargo to mitigate holding costs in the future
Partner with a tech-enabled warehousing provider to provide next generation visibility into your inventory and orders for proactive inventory management
Collaborate with your suppliers to have them manage your inventory levels based on your agreed-upon parameters, reducing your administrative burden and carrying costs
Develop a cross-docking strategy to aggregate order and transfer goods directly from incoming shipments to outgoing shipments without storing them in a warehouse. This greatly reduces storage costs and transit times
The Q4/Q1 timeframe is when many organizations often re-evaluate their warehousing and fulfillment strategies. If this is your organization, consider WarehouseQuote as a solution provider for your next request for proposal. Our unique warehousing model coupled with technology, operations experts, and consulting services can help your organization position inventory in the ideal locations – improving transit times, service levels, and sales while reducing costs.
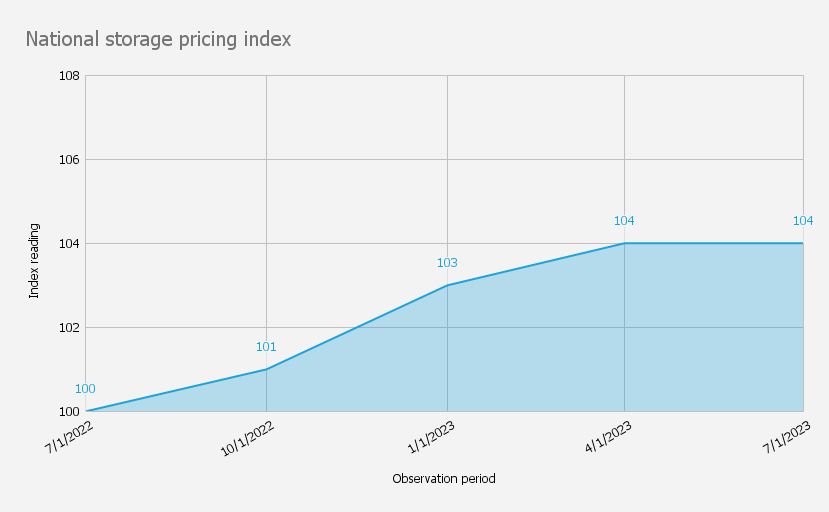
The Warehouse Pricing Index (WPI) is powered by service fees across our global network for ambient warehousing. We have started by defining a baseline of 100 in Q1’ 2021 and looking at changes in costs relative to the average price of the service. Market insights are obtained through interviews with partners from our warehouse network.
National level
Q2’23 versus Q2’22
The national warehouse pricing index reading has remained stagnant Q3’’23 vs Q2’22 as capacity across the market has tightened due to a moderate surge in demand for peak season inventory overflow. Warehouse services pricing has risen moderately at 4 percent year-over-year compared to 8-10 percent year-over-year increases seen early this year.
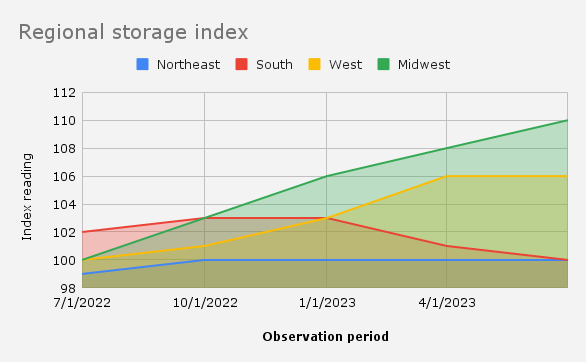
Regional level
The Midwest and West regions lead all regions in Q3’23 with 9.6 and 6.5 percent year-over-year storage pricing increases. The Northeast region has seen little to no change to storage pricing from a year ago, although still elevated.
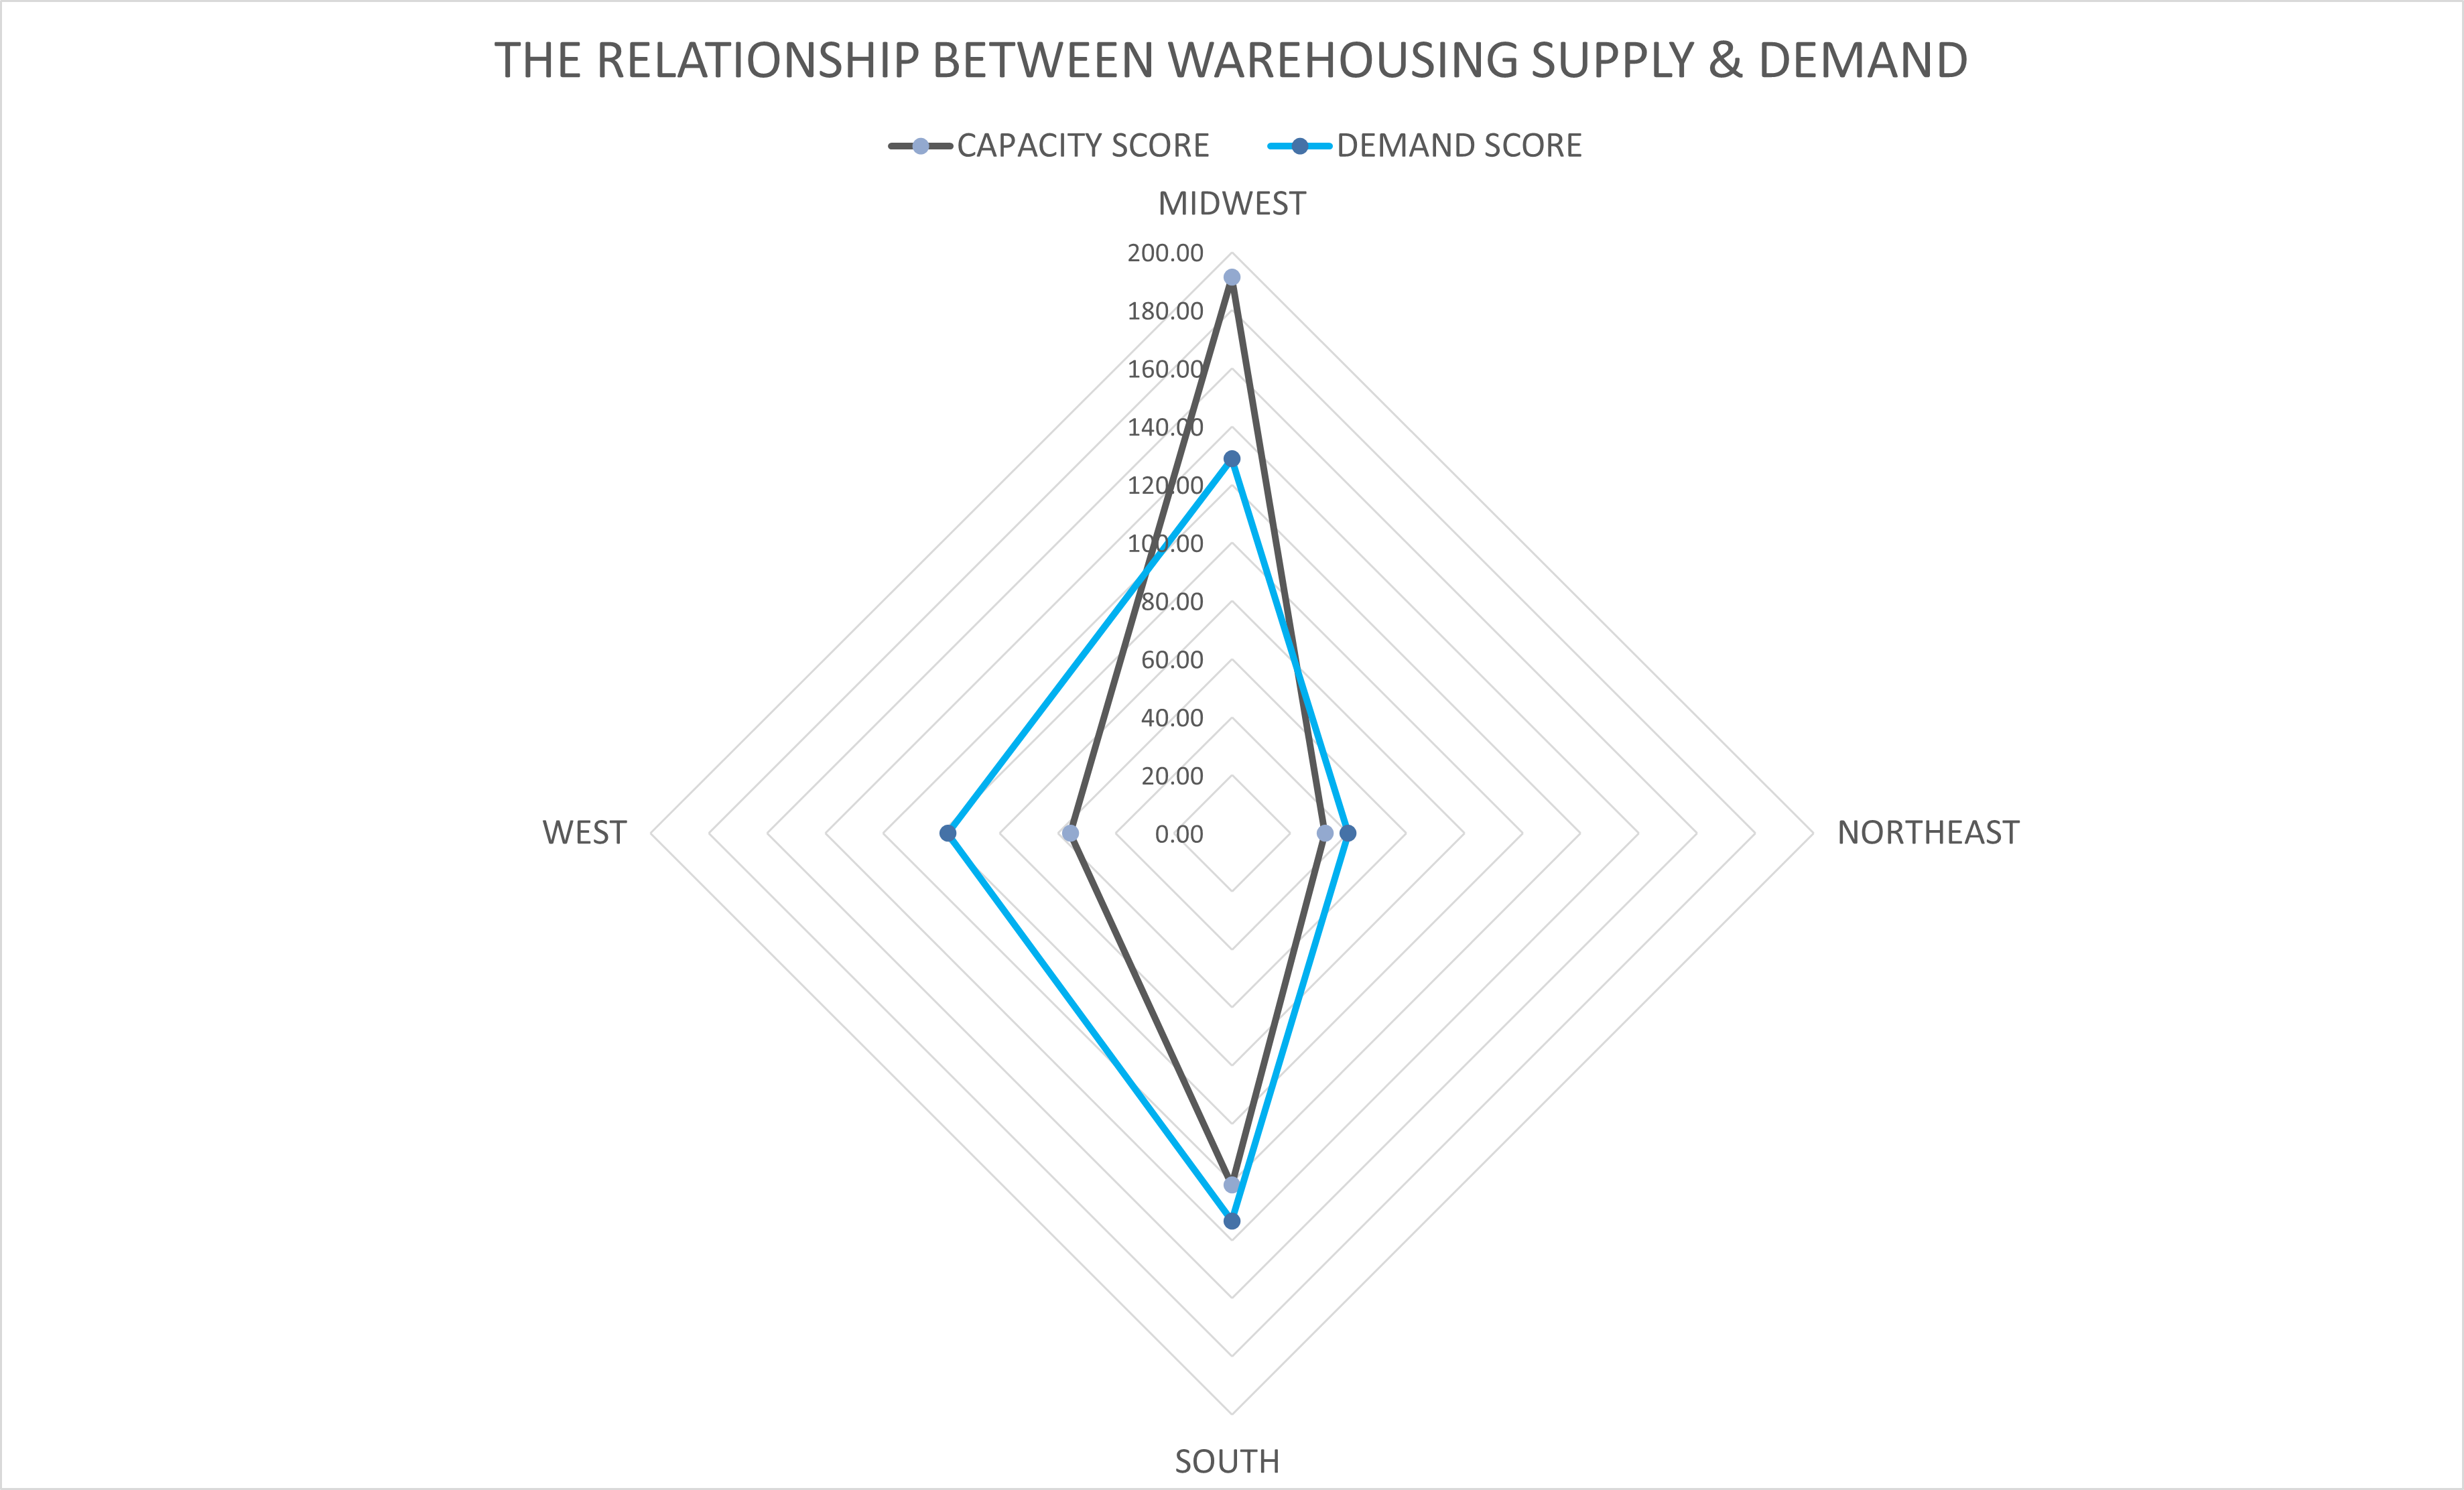
The relationship between 3PL warehousing supply & demand forces
Methodology
Our warehousing supply and demand analysis is powered by capacity and shipper request data across our warehousing network for 2023. We have created a baseline by calculating the aggregate average of both available capacity (in SQFT) and # of shipper requests for warehousing space across each region.
In the visualization above, WarehouseQuote analyzed our 2023 supply and demand data to uncover the relationship between 3PL warehousing supply (available capacity within network) and demand (shipper requests for warehouse space). Based on our analysis, it appears there may be supply and demand gap in the Midwest and West region up to this point of the fiscal year.
The voice of WarehouseQuote
“We continue to see warehouse capacity open up consistently across North America, the costs of operating a 3PL continue to climb due to inflated industrial lease rates and ever-increasing costs of labor. This has led to stagnant pricing quarter-over-quarter, instead of alleviated costs for outsourced inventory management.” Jordan Brunk, Chief Marketing Officer at WarehouseQuote
“While the warehousing market seems to be relaxing, one point to note is that pricing for 3PL services is correlated with real-estate prices. Many of our partners entered into long term agreements. We expect the costs of 3PL services to remain elevated as a result of the dependency on 3-10 year leases.” Mike Adkins, VP of Sales at WarehouseQuote
Exclusive commentary from S&P Global Market Intelligence, C.H. Robinson, and Steam Logistics
After normality: Supply chain inventory management
Chris Rogers Head of Supply Chain Research, S&P Global Market Intelligence
In the midst of the US peak shipping season, it looks like supply chains have returned to normal. Looking ahead, S&P Global Market Intelligence’s outlook finds that the lessons of the past five years suggest investments in supply chain resilience and particularly inventory management should be increased. It’s not clear that they are.
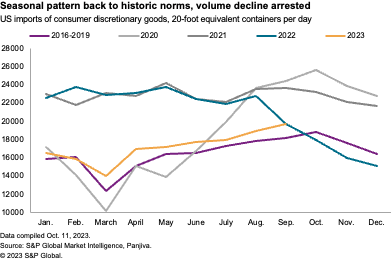
The slowdown in consumer spending and inventory destocking in 2023 has led to a marked slowdown in US seaborne imports in 2023. That process slowed in September with shipments up by 1% in the month of September.
The pattern of seasonality of shipments appears to have returned to pre-pandemic forms through September after three years of disruptions caused by pandemic-era elevated demand, logistics disruptions and rising costs of commodities and interest rates.
Looking ahead, the source of disruptions in late 2023 and into 2024 are returning to the trade policy and operational uncertainties typically seen in the late 2010s.
Physical infrastructure disruptions are ongoing, including water shortages in the Panama Canal and rivers ranging from the Mississippi to the Amazon. Cross-border transit and rail delays on the Mexico-US border look set to continue.
Labor action in the logistics sector has largely been averted with deals reached in the US west coast ports and rail sectors. The ongoing United Auto Workers’ (UAW) strike against the “Big 3” automakers, the failed ratification of a UAW deal with Mack Truck and forthcoming negotiations in Europe suggest disruption risks will likely continue.
Geopolitics and widening kinetic conflict have already acted to disrupt supply chains ranging from electronics and energy to food and fertilizers.
Tariffs are unlikely to change in the near term, despite the ongoing review of US Section 301 duties on imports from mainland China. Uncertainties will abound heading into the November 2024 elections though.
While risks abound, there’s evidence that firms are not pursuing more prudent “just-in-case” inventory management strategies. That’s likely because the period of destocking comes at the same time as a need to conserve cash in the face of weaker activity and rising costs.
US retail inventory-to-sales ratios in some sectors have returned to pre-pandemic levels, with furniture, home appliances and electronics stores standing at 1.59x in July 2023 compared with 1.58x average in 2016 to 2019. Similarly, clothing and apparel reached 2.37x in July 2023 compared with 2.44x in 2016 to 2019.
Manufacturers’ inventories of finished goods are continuing to decline, S&P Global Purchasing Managers’ Index (PMI) data shows, though the rate of decline is slowing. That’s partly thanks to improving inventories in the automotive sector, where stocks of finished goods have increased in three of the four months to August 2023, ahead of the UAW strikes.
Manufacturing inventories in electronics — including computing and telecoms — as well as raw materials ranging from chemicals to metals are continuing their descent.
This article was published by S&P Global Market Intelligence and not by S&P Global Ratings, which is a separately managed division of S&P Global.
Full Truckload: Capacity contraction remains below analyst expectations
Steve Raetz Director of Research and Market Intelligence, C.H. Robinson
The full truckload spot market has been at cost levels or at estimated cost to operate levels for the nearly 18 months. This has made it difficult for the owner-operator carrier community who spend a majority of their time in the spot market on thin to negative operating ratios. With thin to negative operating ratios and muted trucking demand, market capacity is contracting well below the pace of analyst expectations.
Based on C.H. Robinson and industry analyst research, here are few hypotheses for how small carriers have been able to stay operational in this elongated down cycle:
Carriers built up cash reserves
PPP loans from Small Business Administration of the U.S. government during the pandemic period
Exceptional high rates per mile in the spot market in 2021
Capacity options for owner operators
Owner-operators shifting to independent contract service for fleets (retaining their operating authority)
Power only services from brokers like C.H. Robinson where owner operators pull shared trailer pools
The question that still remains is, “how long can the slow rate of contraction persist, and will it accelerate?”. A key consideration may be the forecasted price of oil and the resulting impact on the retail diesel cost per gallon. Goldman Sach suggested in an article that $100/barrel oil is possible in 2024 as they model out global demand and production in light of Opec+ stated goals and US fracking industry expectations.
C.H. Robinson’s perspective and recommendations for shippers: Rising diesel prices could accelerate the contract rate of small carrier capacity, leading the freight market toward a balanced state
If diesel pricing rises and holds a sustained rise for some time, most analysts suggest this would accelerate the contraction rate of small carrier capacity and help move the market toward balance sooner than later. Fuel surcharges cover the loaded mile for a carrier. Owner operators in the spot market have a higher percentage of empty miles (than larger fleet peers), repositioning to their next load.
Higher diesel pricing for those repositioning miles may be too much for those carriers who are already barely covering costs. While predicting precisely when the truckload spot market will turn toward balance is difficult to forecast, oil and diesel pricing might be a helpful lens to the rate of capacity contraction and line of sight to market balance.
Jon Poehnelt Chief Commercial Officer, Steam Logistics
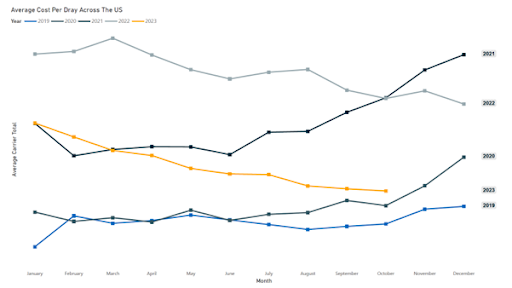
Although many times the less talked about mode of transportation, the return to “normal” for drayage has been one of the biggest reliefs for supply chain and logistics managers. During the disruptions of 2021 and 2022, companies without a strong drayage partner were significantly impacted by unexpected and frustrating costs of demurrage, extended chassis days, and per diem. Today, we have minimal congestion at ports and rails across the US. Chassis equipment is readily available, and drayage capacity remains abundant despite the considerable drop in registered intermodal drivers in August. The average cost of a drayage move has declined over 40% since the fall of 2022 and has dropped 20% since May 2023 when many shippers signed ocean contracts that included the door drayage service.
Regionally, 2023 drayage costs in the South Atlantic, Pacific Northwest, Central, and Gulf are now within a single-digit percentage difference of their 2019 pre-pandemic averages.
The Pacific Southwest remains the outlier, where the average cost of a dray move is 53% higher compared to 2019. Higher fuel costs, the AB5 legislation, and the significant pressure by the California Air Resource Board, which is requiring dray carriers to transition to zero-emissions is keeping the costs of drayage higher on the west coast.
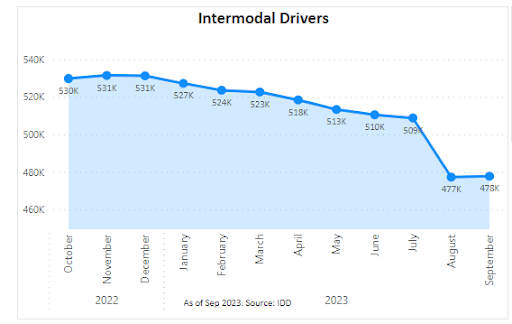
On the supply side, there was a steep decline in UIAA-registered drivers in August as rate levels moved closer to being unsustainable for smaller carriers and owner-operators.
The good news for carriers is that the rate levels and the driver supply have leveled off. The number of registered drivers – 478k in September – is within a few percentage points of the 471k drivers registered in September 2019.
These indicators all point to drayage costs being at, or extremely near, the bottom, as the supply side has corrected to match demand.
However, we are far from a positive outlook for drayage carriers. Ocean container demand has increased minimally over the last few months and there is no expectation to have any significant rebound in 2024.
Most dray carriers are smaller carriers, and many are owner-operators. Insurance costs, fuel costs, zero-emission equipment costs, and higher interest rates will put pressure on drayage carrier solvency over the next few months.
Unless we see a substantial decline in the number of carriers or drivers or a shock, such as prolonged labor dispute, we expect the average drayage cost to stay flat in the near term with minimal congestion. It’s looking like a pleasant return to normalcy.
Steam Logistics is one of the fastest growing 3PLs in the US, moving over 120,000 containers and over 300,000 domestic and intermodal shipments a year. Steam’s integrated supply chain solutions help shippers get it right every time – for every shipment, across every mode of transportation worldwide.
Explanation of terms
Middle Market Business Index
In partnership with the U.S. Chamber of Commerce, RSM has collected data on middle market firms since 2015 through quarterly surveys conducted by The Harris Poll. The RSM US Middle Market Business Index provides a leading measure on the performance of businesses that make up the heart and soul of our country’s economy.
United States regional divisions
Midwest
East North Central: Illinois, Indiana, Michigan, Ohio, and Wisconsin
West North Central: Iowa, Kansas, Minnesota, Missouri, Nebraska, North Dakota, and South Dakota
Northeast
New England: Connecticut, Maine, Massachusetts, New Hampshire, Rhode Island, and Vermont
Middle Atlantic: New Jersey, New York, Pennsylvania
South
South Atlantic: Delaware, Florida, Georgia, Maryland, North Carolina, South Carolina, Virginia, Washington DC, and West Virginia
East South Central: Alabama, Kentucky, Mississippi, and Tennessee
West South Central: Arkansas, Louisiana, Oklahoma, and Texas
WarehouseQuote’s economic commentary disclaimer
The material and content used in this publication is for informational purposes only. Reference to any third party (including external hyperlinks) does not constitute or imply the endorsement of said third party. WarehouseQuote does not warrant the accuracy or completeness of the Content. The views and opinions expressed herein are those of the author and do not necessarily reflect the official policy or position of WarehouseQuote. Reproduction of the Content may be made only with the written permission from WarehouseQuote.
Chris Rogers Head of Supply Chain Research, S&P Global Market Intelligence
Steve Raetz Director of Research and Market Intelligence, C.H. Robinson
Jon Poehnelt Chief Commercial Officer, Steam Logistics
About WarehouseQuote
WarehouseQuote is a managed warehousing solution helping middle market and enterprise businesses scale their warehouse operations with precision. Through our 3PL warehousing and fulfillment network of 250+ facilities, integrated technology platform, and in-house supply chain expertise, we enable businesses to design efficient fulfillment networks connected by a single technology platform. Hundreds of B2B and B2C businesses like Chatime, Joyride, Benitago Group, Big Ass Fans, and Mighty Good Solutions use WarehouseQuote to scale, streamline, and optimize their warehouse operations.