8.0 percent increase in the national average warehouse storage costs year-over-year, inline with industry leading surveys including the March CNBC supply chain survey
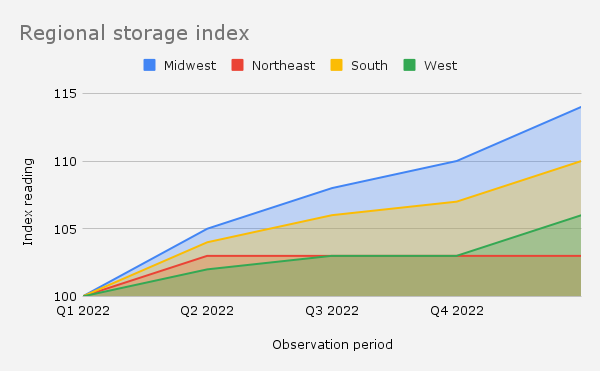
The Midwest and South regions are seeing the highest year-over-year warehouse storage cost increase
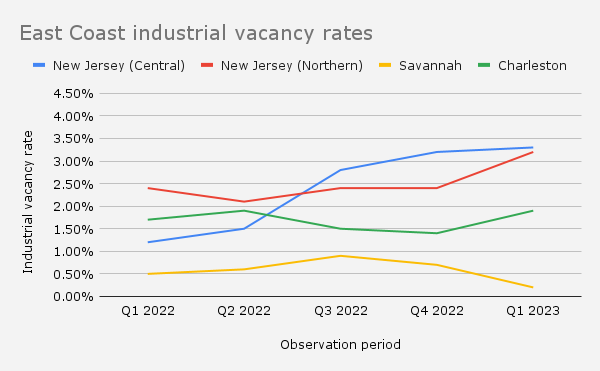
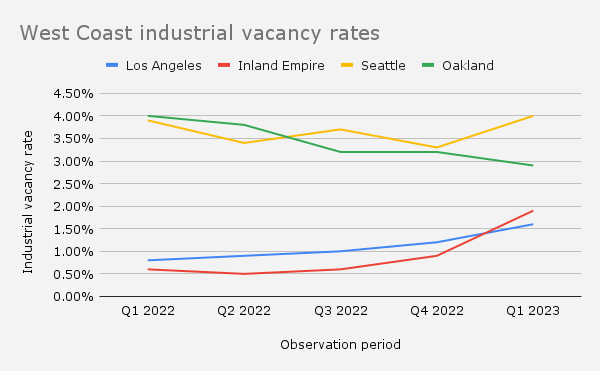
Industrial vacancy rates are rising slightly, up 40 bps to 3.6 percentin Q1’23
3 out of 4 West Coast port markets saw increased vacancy rates this quarter, with the Inland Empire increasing from 0.9 to 1.9 percent
0.2 percentvacancy rate in Savannah signals capacity constraints on the East Coast
US economy
Consumer Price Index
The Consumer Price Index of All Items rose just 0.1 percent in March and 5 percent from a year ago. Excluding shelter, the CPI rose 3.4 percent from a year ago. This marked the smallest increase since June 2021.
US ISM Purchase Managers Index
The March Purchasing Managers Index (PMI) reading registered 46.3, 1.4 percentage points lower than February. This figure represents the fourth consecutive month of contraction after a 30-month period of expansion. New Orders fell 2.7 percentage points in March, representing the seventh consecutive month of contraction.
RSM Middle Market Business Index
RSM’s Q1 2023 Middle Market Business Index showed positive sentiment from middle market firms. The reading came in at 134.0, a 9 percent increase from Q4’ 2022. The overall sentiment of the economy from middle market executives also increased. Yet, 53 percent of firms saw inventories rise in Q1, up from 46 percent in the prior quarter. This will be something to closely monitor in Q2.
March CNBC Supply Chain survey
36 percent of logistics experts expect inventory levels to normalize in the second half of 2023. With March’s PMI reading for new orders down 2.7 percent, it appears that firms are holding off on producing more products until they can rightsize inventories.
US industrial real estate vacancy rates
The overall U.S. industrial vacancy rate increased 40bpsin Q1’23 to 3.6 percent, but still sits below the 10-year historical average of 5.3 percent. This is mainly due to the number of speculative deliveries and the normalization of demand. At the regional level, the Savannah port market has essentially no available capacity while 3 out of 4 West coast port markets saw increased industrial vacancy rates. This will be something to watch closely in the quarters ahead and could be showing the impacts from diversion of trade, ongoing port labor challenges, and the diversification of sourcing strategies.
East coast
West coast
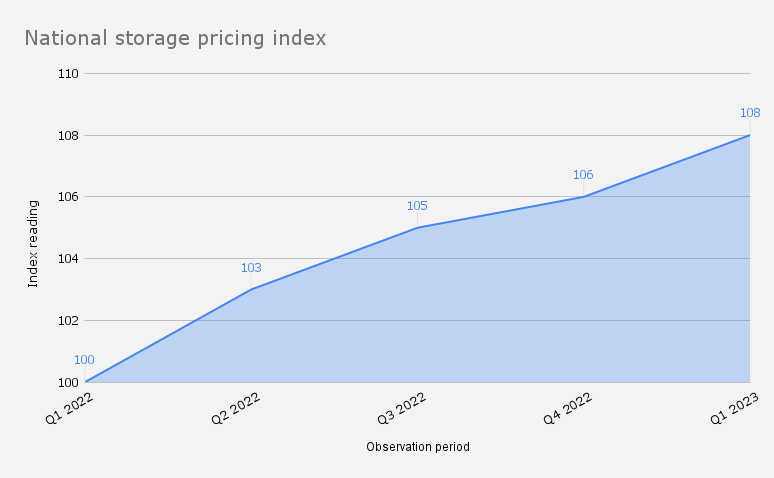
Warehouse Pricing Index
National level
The national warehouse storage pricing index increased8 percent year-over-year ending March. On a quarterly basis, the index reading increased 2 percent in Q1’23 versus Q4’22.
Regional level
At the regional level, the Midwest and South regions lead all regions with double-digit year-over-year increases at 10 and 14 percent, respectively. The Midwest region continues to see an influx of businesses seeking centrally located warehousing solutions. The South region signals the affects from the diversion of trade due to West coast port disruptions.
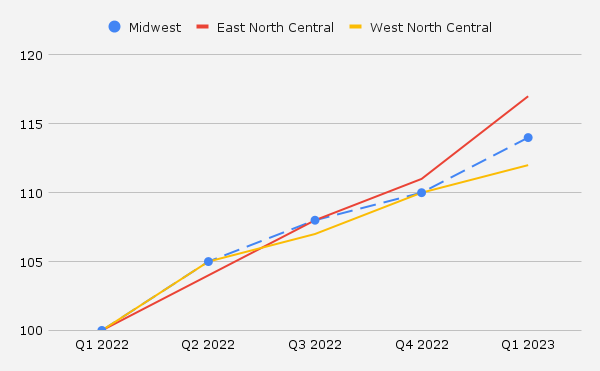
Midwest Pricing Index
This index includes data from the East and West North Central divisions
The Midwest region has seen a 14.2 percentyear-over-year increase and a 3.3 percent increase in Q1’23 versus Q4’22 in warehouse storage pricing. At the divisional level, the East North Central had slightly higher year-over-year increases at 16.9 percent opposed to 12.1 percent in the West North Central division ending in March 2023.
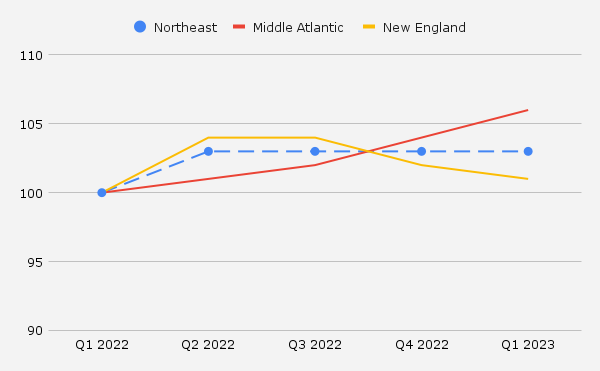
Northeast Pricing Index
This index includes data from the Mid Atlantic and New England divisions
The Northeast region has seen a 3.5 percent year-over-year increase and remained unchanged in Q1’23 versus Q4’22. At the divisional level, the Middle Atlantic saw the biggest uptick in pricing at 5.9 percent opposed to New England with a 0.9 percentyear-over-year increase, respectively.
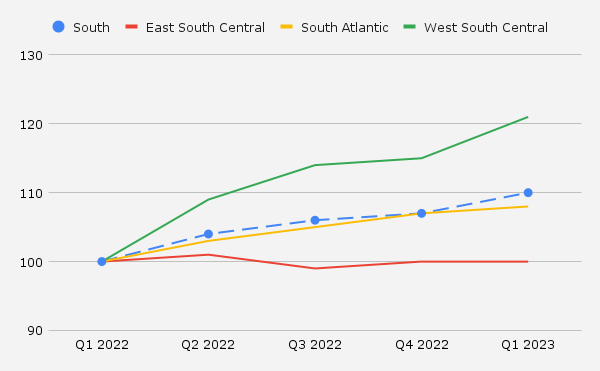
South Pricing Index
This index includes data from the East South Central, South Atlantic, and West South Central divisions
The south region has seen a 10 percent year-over-year and 2.6 percent increase in Q1’23 versus Q4’22 in warehouse storage pricing. At the divisional level, West South Central has seen a significant rate increase up 21 percentyear-over-year, respectively.
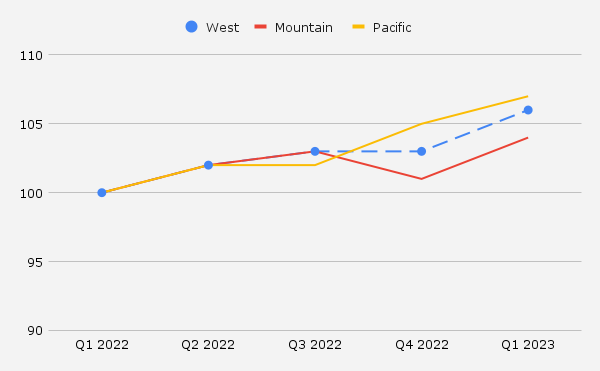
West Pricing Index
This index includes data from the Mountain and Pacific divisions
The west region has seen a 5.7 percent increase year-over-year and a 2.2 percent increase in Q1’23 versus Q4’22 in warehouse storage pricing. At the division level, the pacific region saw a 7.1 percent increase and the Mountain division saw a 4.3 percent increase year-over-year, respectively.
WarehouseQuote’s perspective and recommendations
We expect third-party warehousing vacancy rates to loosen up towards the second half 2023 as more capacity enters the market due to increased 3PL leasing activity and firms rightsizing inventories. In Q1 ’23, the national industrial real estate vacancy rate increased 40 bps to 3.6 percent.
In 2022, 3PL providers surpassed all sectors in leased big box warehouse space for the first time ever. With new capacity entering the market, third-party logistics providers are expected to continue leading industrial real estate leasing activity.
As for inventories, they still remain a challenge for middle market firms. According to the Q1’23 RSM Middle Market Business Index (MMBI), 53 percent of firms with inventories saw their stockpiles rise in the first quarter, up from 46 percent in the prior period. Yet, the vast majority of firms remain optimistic about the second half of 2023.
“36 percent of respondents expect their inventory levels to return to normal in the second half of 2023” – CNBC Supply Chain Survey
As firms look to rightsize inventories,both customer expectations and warehouse storage costs are still rising. It’s paramount that middle market and enterprise businesses seek to better understand their supply chain data, consider and take action on cost reduction and risk mitigation strategies, and prioritize investments in supply chain technology.
Make intelligent decisions leveraging big data
The analysis of historical outbound order distribution data coupled with the consideration of forecasted population shifts and labor pools often uncover ideal markets that may have been previously out of reach. This is an important cost-savings and risk mitigation opportunity that firms should not overlook.
Navigate economic headwinds with asset-light warehousing solutions
We recommend firms to consider asset-light warehousing solutions amid economic headwinds. Agile warehousing solutions can provide the flexibility needed to help reduce capital expenditure, increase flexibility, and improve operational efficiency.
Prioritize investments in supply chain technology
Rising warehouse storage costs also increase the need for firms to prioritize investments in supply chain technology. In a recent CNBC Supply Chain Survey, 57 percent of respondents said their warehouse charges increased 10+ percent from last year.
The adoption of supply chain technology can provide firms with inventory visibility and SKU analytics. This level of insight can help in identifying slow-moving SKU’s and support the deployment of proactive supply chain strategies to reduce inventory carrying costs and improve profitability.
Exclusive commentary
Chris Rogers Head of Supply Chain Research, S&P Global Market Intelligence
What is normal, anyway? Supply chain activity is still slowing
By most measures supply chain activity has returned to a degree of normality, or at least smoother running, in the first quarter of 2023. Suppliers’ delivery times are back to pre-pandemic levels, as shown by the S&P Global Market Intelligence PMI measure and outlined in our recently published 2023 outlook report.
After ordering early – and arguably over-ordering – in 2022, many retailers have had success in cutting back their inventories via price discounting. Yet, many have further to go. For example, the seasonally-adjusted, inventory-to-sales ratio of US furniture, electricals and electronics retailers reached 1.68x in January compared to a pre-pandemic average of 1.57x based on US Census Bureau data.
While that may be a sign that just-in-case stocking strategies are in vogue, it’s more likely a sign that the over-ordering headache persists.
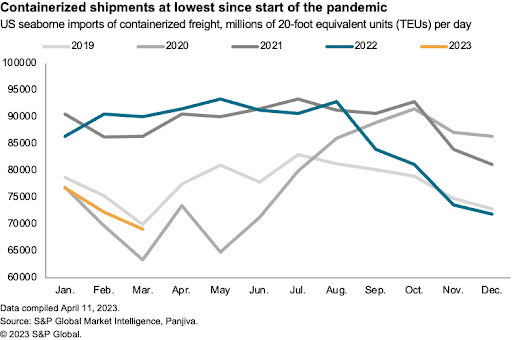
The latest trade flow data suggests the supply chain activity slowdown is continuing. The chart above shows S&P Global Market Intelligence Panjiva data for US seaborne imports. On a year-over-year basis, shipments fell by 23 percent year-over-year in March. On a days-adjusted basis, handling was the lowest since May 2020.
The decline has been driven by consumer durable goods, which fell in aggregate by 34 percent and included a 45 percent drop in home furnishings and a 46 percent slide in leisure products (toys and exercise equipment, for example).
Looking ahead there are at least two factors to consider.
First is whether companies will hold their nerve and complete seasonal shipments on the basis of the “old normal”, or whether new strategies such as phased ordering or just-in-case stocking will be pursued. A profit- and cash-flow squeeze may lead to low-cost rather than low-risk approaches being preferred.
Second is the overall level of trade flows later in the year. S&P Global Market Intelligence’s Global Trade Analytics Suite forecast indicates that global trade activity will increase by 2.5 percent year-over-year by Q4’23 on a real (i.e. inflation-adjusted) basis. Growth is expected to be led by industrial products including chemicals, metals and machinery rather than consumer goods.
So, while there’s evidence of a return to smooth supply operations, it’s too soon to say whether we’re simply back to the “old normal”, or whether new methods of operation will emerge on a widespread basis.
C.H. Robinson’s perspective on the state of the transportation market
Steve Raetz Director of Research and Market Intelligence, C.H. Robinson
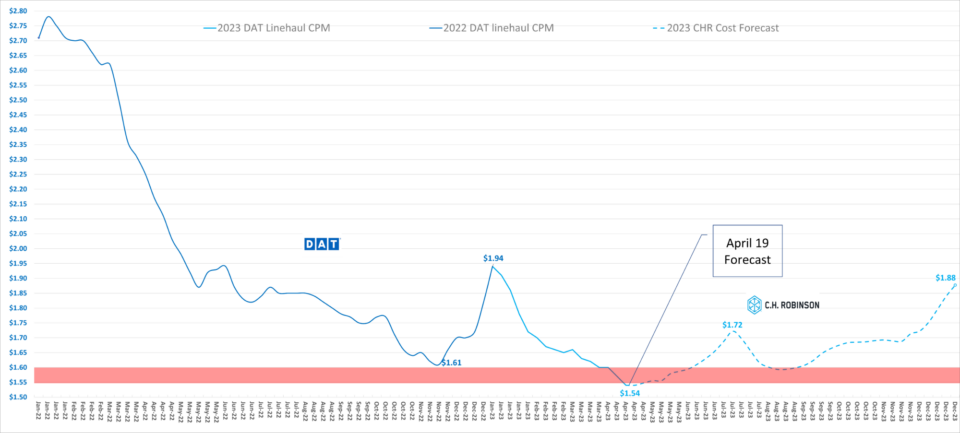
Today’s truckload market sits at the bottom
It’s likely that today’s truckload market is at the ‘bottom of the market’ as cost per mile falls to the cost per mile to operate a truck. In the graph below, C.H. Robinson has developed an estimated cost-per-mile forecast for the dry van spot market based on DAT historical data. Also shown is C.H. Robinson’s forecasted extension of the American Transportation Research Institute (ATRI) historical costs to operate a truck through 2021.
The C.H. Robinson forecast shows normal seasonal downward movement of cost per mile in January and bottoms out at the estimated cost per mile to operate a truck. This monthly update includes the April forecast, which anticipates more price movement in the van spot market later in the year than was forecasted in early January.
Today’s LTL market sits in a ‘balanced’ state
The LTL industry continues to be relatively balanced due to cross dock/terminal rationalization over the past 12 years amidst material growth in LTL tonnage. Of late, carriers have started investing to expand docks to help support continued growth. These expansion plans result in about 1-2 percent capacity gain per year.
The 2022 and 2023 tonnage declines will move the LTL market from undersupplied to balanced. LTL carriers are currently displaying pricing discipline and continue taking single digit price increases with some select declines where volume is needed.
Research-driven LTL insights
The following insights are based on research from MIT and C.H. Robinson
Weight (large volume shipments) is correlated to on-time pickup
The Warehouse Pricing Index (WPI) is powered by service fees across our global network for ambient warehousing. We have started by defining a baseline of 100 in Q1’ 2021 and looking at changes in costs relative to the average price of the service. Market insights are obtained through interviews with partners from our hybrid warehouse network.
Explanation of terms
Industrial real estate vacancy rates
Industrial real estate vacancy rate is the percentage of available industrial property, such as a warehouse or distribution center.
United States regional divisions
Midwest
East North Central: Illinois, Indiana, Michigan, Ohio, and Wisconsin
West North Central: Iowa, Kansas, Minnesota, Missouri, Nebraska, North Dakota, and South Dakota
Northeast
New England: Connecticut, Maine, Massachusetts, New Hampshire, Rhode Island, and Vermont
Middle Atlantic: New Jersey, New York, Pennsylvania
South
South Atlantic: Delaware, Florida, Georgia, Maryland, North Carolina, South Carolina, Virginia, Washington DC, and West Virginia
East South Central: Alabama, Kentucky, Mississippi, and Tennessee
West South Central: Arkansas, Louisiana, Oklahoma, and Texas
WarehouseQuote’s economic commentary disclaimer
The material and content used in this publication is for informational purposes only. Reference to any third party (including external hyperlinks) does not constitute or imply the endorsement of said third party. WarehouseQuote does not warrant the accuracy or completeness of the Content. The views and opinions expressed herein are those of the author and do not necessarily reflect the official policy or position of WarehouseQuote. Reproduction of the Content may be made only with the written permission from WarehouseQuote.
Chris Rogers Head of Supply Chain Research, S&P Global Market Intelligence
Steve Raetz Director of Research and Market Intelligence, C.H. Robinson
About WarehouseQuote
WarehouseQuote is a managed warehousing solution helping middle market and enterprise businesses scale their warehouse operations with precision. Through our 3PL warehousing and fulfillment network of 250+ facilities, integrated technology platform, and in-house supply chain expertise, we enable businesses to design efficient fulfillment networks connected by a single technology platform. Hundreds of B2B and B2C businesses like Chatime, Joyride, Benitago Group, Big Ass Fans, and Mighty Good Solutions use WarehouseQuote to scale, streamline, and optimize their warehouse operations.