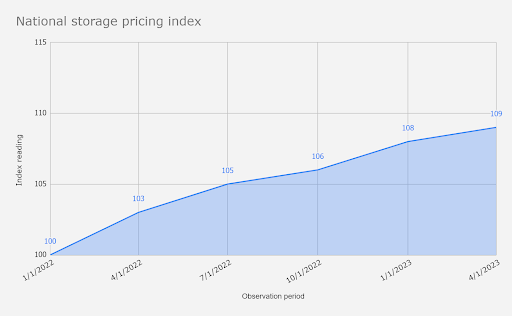
9 percent increase in the national average of warehouse storage since Q1’22
The Midwest and South regions continue to lead all regions with 16.5 and 9.6 percent increases from Q2’22 to Q2’23
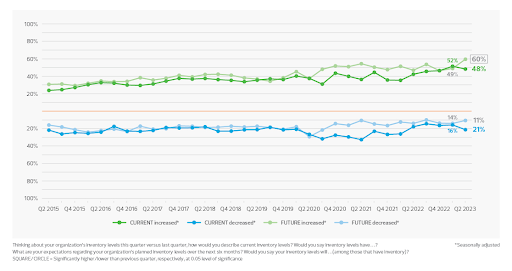
RSM’s Middle Market Business Index (MMBI) eases to 131.4 in Q2’23, down 2.6 basis points from Q1’23
June’s Logistics Manager Index (LMI) reading comes in at 45.6, a new all-time low and the fourth consecutive month of contraction
WarehouseQuote has received an influx of west coast operators requesting to join our network as capacity grows due to reduced import volumes and rightsized inventories
In this report, we’ve summarized interviews with our California operators to review their thoughts on labor, port issues, and inventory levels on the West Coast.
RSM Middle Market Business Index (MMBI)
RSM’s Q2 2023 Middle Market Business Index reading indicated that overall business conditions remained solid for middle market firms at 131.3, a 2.6 basis point decrease from Q1. However, only 35 percent of respondents said the economy improved in Q2, down from 45 percent in the previous quarter.
Index
June 2023 Index
May 2023 Index
Month-Over-Month Change
Projected Direction
Rate of Change
LMI
45.6
47.3
-1.7
Contracting
Faster
Inventory Levels
42.9
49.5
-6.5
Contracting
Faster
Inventory Costs
57.1
64.4
-7.3
Expanding
Slower
Warehousing Capacity
63.5
56.7
6.8
Expanding
Faster
Warehousing Utilization
56.8
54.7
2.1
Expanding
Faster
Warehouse Prices
63.3
62.8
0.6
Expanding
Faster
Transportation Capacity
71.2
69.3
1.9
Expanding
Faster
Transportation Utilization
46.8
45.5
1.3
Contracting
Slower
Transportation Prices
32.8
27.9
4.8
Contracting
Slower
Logistics Managers Index
This month’s Logistic Managers Index (LMI) reading indicates firms are continuing to rightsize inventories. Inventory levels (-6.5) and costs (-7.3) are down which is leading to an increase in warehousing and transportation capacity. Yet, warehouse prices remain unchanged, to slightly elevated, across the country.
Industrial real estate vacancy rates
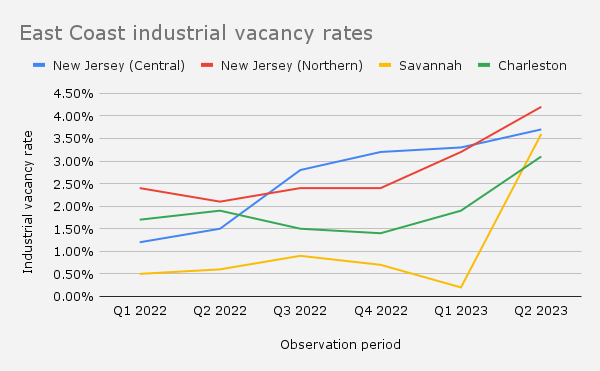
East coast
All east coast port markets saw an increase in industrial vacancy rates with Savannah with the largest quarter-over-quarter jump from 0.2 to 3.6 percent, respectively.
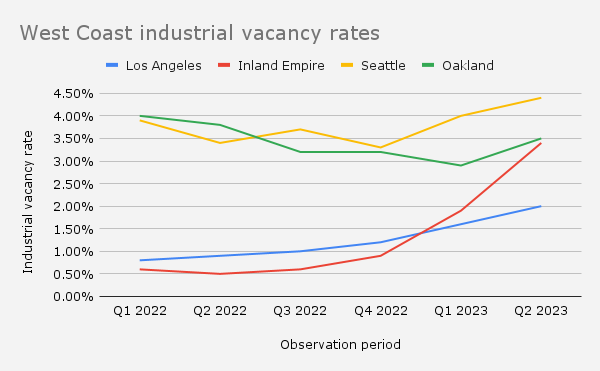
West coast
In 2022, the Inland Empire had nearly a 0 percent vacancy rate. Today, the market sits at a 3.6 percent vacancy rate. Other West Coast port markets like Seattle, Los Angeles, and Oakland also see rises in industrial vacancy rates.
Warehouse Pricing Index
The Warehouse Pricing Index (WPI) is powered by service fees across our global network for ambient warehousing. We have started by defining a baseline of 100 in Q1’ 2021 and looking at changes in costs relative to the average price of the service. Market insights are obtained through interviews with partners from our warehouse network.
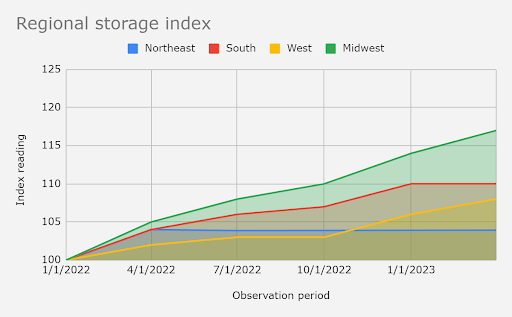
National level
Q2’23 versus Q2’22
9 percent year-over-year increase in warehouse storage pricing ending March. 2 percent increase in warehouse storage pricing in Q2’23 versus Q1’23.
Regional level
The Midwest and South regions continue to lead all regions with 16.5 and 9.6 percent increase in warehouse storage pricing year-over-year. The demand for warehousing space in centrally located markets has continued to grow due to the cost-efficiency and nationwide 2-day ground shipping coverage. The West Coast has remained at an 8.5 year-over-year pricing increase. The Northeast sits 3.4 percenthigher year-over-year with the Middle Atlantic division (NY, NJ, PA) up6.9 percent year-over-year.
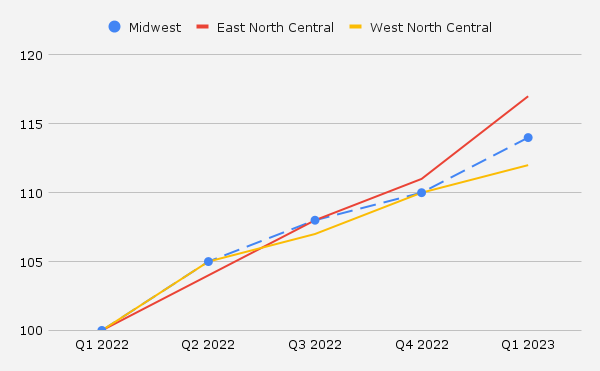
Midwest Pricing Index
This index includes data from the East and West North Central divisions
The Midwest region has seen a 16.5 percent year-over-year increase and a 2.3 percent increase in Q2’23 versus Q1’23 in warehouse storage pricing. At the divisional level, the East North Central had seen a 17.0 percent increase year-over-year. The West North Central has seen 16.0 percent year-over-year increase with a 3.5 percent increase in Q2’23 vs. Q1’23.
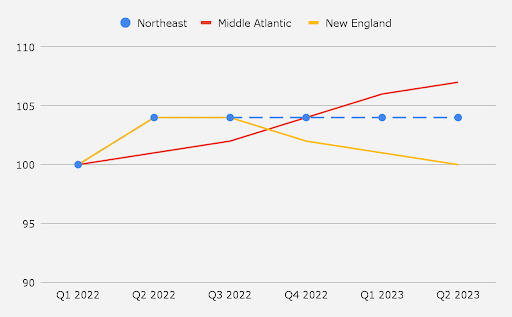
Northeast Pricing Index
This index includes data from the Middle Atlantic and New England divisions
The Northeast region has seen a 3.4 percent year-over-year increase and remained essentially unchanged in Q2’23 versus Q1’23. At the divisional level, the Middle Atlantic (NY, NJ, PA) saw the biggest uptick in pricing at 6.8 percent opposed to New England with a 0.9 percent (MA, RI, and CT) year-over-year increase, respectively.
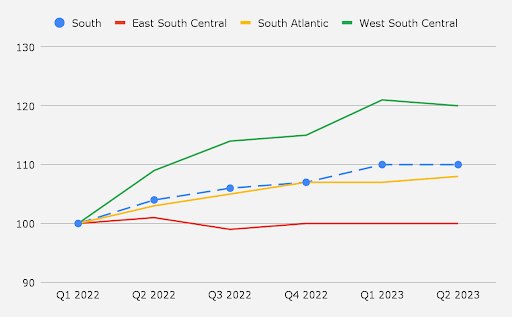
South Pricing Index
This index includes data from the East South Central, South Atlantic, and West South Central divisions
The South region has seen a 9.6 percent year-over-year increase in warehouse storage pricing year-over-year. However, the region saw a slight decrease of -0.2 percent in Q2 ’23 vs Q1′ 23. At the divisional level, West South Central (Texas) has seen a significant average increase at 20.4 percent year-over-year, respectively.
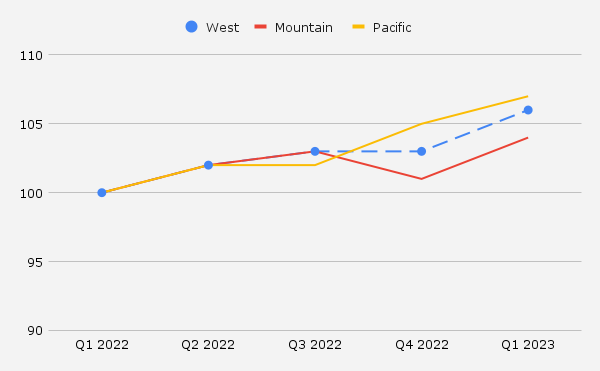
West Pricing Index
This index includes data from the Mountain and Pacific divisions
The West region has seen an 8.5 percent increase year-over-year and a 2.6 percent increase in Q1’23 versus Q4’22 in warehouse storage pricing. At the division level, the Pacific region saw an 8.9 percent increase and the Mountain division saw an 8.0 percent increase year-over-year, respectively.
As mentioned above, WarehouseQuote has received a recent influx of West Coast warehouse operators requesting to join our network. Our team conducted interviews with network operators to understand the impact of reduction in import volumes, recent labor strikes, and firms rightsizing their inventories.
Voice of the west coast warehousing market
“Many businesses have been diversifying their port usage, transportation, sourcing, and 3PL strategies as a result of the recent port strikes.” – Joe Spisak, CEO of Fulfill.com
“Inventory space is generally becoming more available on the West Coast. However, we expect this to be short-lived.” – West Coast Network Partner
WarehouseQuote’s perspective and recommendations
WarehouseQuote continues to see capacity open up in key markets like California, yet pricing has stayed steady at 8-10 percent year-over-year increases. We expect capacity levels to remain flat throughout the rest of the year as many firms will still need short-term warehousing solutions for peak season overflow.
Warehouse pricing should also remain stable due to the cool off of the warehousing labor market. Since the pandemic, the U.S. warehousing and storage sector has added 700k+ jobs. The average hourly pay for warehouse labor has also increased 8 percent since May 2020 (BLS), inline with pricing fluctuations we are seeing in the market at this time.
Since June 2022, job growth in the warehousing and storage sector has been on the decline. The sector has shed 41,000+ jobs due to the pullback in online sales growth and economic uncertainty. With more warehouse employees available in the market, plus the halt in hiring new employees, we should expect warehouse prices to remain steady until consumer demand and the broader economic outlook improves.
WarehouseQuote’s H2 2023 market predictions
The 2023 peak season consumer demand will be comparable to 2022 levels
Warehouse capacity will continue to expand following peak season
Quick tip ahead of the 2023 peak season
“It’s important for merchants of all sizes to have contingency plans in place to navigate potential port and transportation market disruptions this peak season. Please reach out to coordinate these plans so your business can have a smooth 2023 peak season.”– Mike Adkins, VP of Sales
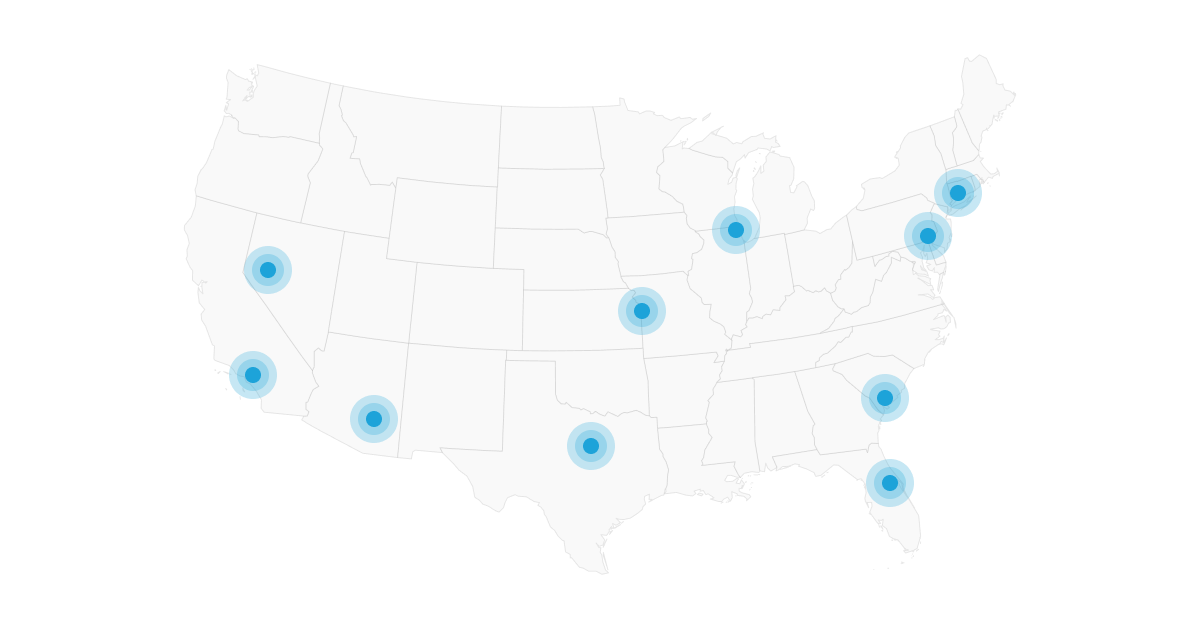
Key markets with available network capacity
We’ve included a network map of key markets with available capacity within our network. Please reach out if your firm is looking to secure space ahead of the 2023 peak season.
Exclusive commentary from S&P Global Market Intelligence and C.H. Robinson
Chris Rogers Head of Supply Chain Research, S&P Global Market Intelligence
Proving the normality pudding: The US west coast peak shipping season
An ongoing theme for S&P Global Market Intelligence in 2023 is the return to normality for supply chain operations. As discussed in our latest outlook report we’ve identified data from purchasing managers, corporate financial information and bill-of-lading records which show the normal order has largely returned.
The inventory situation is notable in that many industries have been cutting stocks in response to reduced demand, particularly for consumer goods.
There’s a significant divergence by sector. Inventories as a ratio of sales are back to 2016-2019 average levels in fashion and home appliances, while for building supplies and personal computing they are well above normal. Firms in the latter two sectors generally expect a recovery in demand later in 2023.
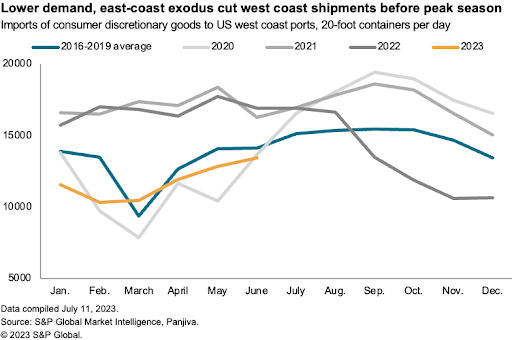
Yet, the proof of the normality pudding will only come during the peak shipping season for consumer goods. This can be tracked via bill of lading data and is particularly relevant for the west coast ports that remain central to Asia-North America trade despite recent diversions.
Containerized, seaborne imports of consumer goods to US west coast ports fell by 34% year over year in the first quarter of the year before dropping by a further 25% in Q2 ’23 according to S&P Global Market Intelligence data.
There’s at least three dynamics at play here: reduced demand for consumer goods following the pandemic-era splurge; an overhang of inventories built up in early 2022; and a shift in shipping towards the US east coast. All three will likely continue to play out during the rest of 2023.
Optically, the seasonality of 2023 looks more like the 2016 to 2019 period than it does compared to the pandemic-afflicted 2020, the congestion-year of 2021 or the ship-early period of early 2022. If anything, the month-to-month volatility in shipments in 2023 appears smoother than in prior years, suggesting all is not yet completely normalized.
A major complicating factor is physical risk, which is never far away for supply chains. In late 2023 there are two major factors to watch for shipments into the US west coast, and in turn for warehouse demand patterns in the region.
First, the prospect of labor actions still hangs over the logistics sector with strikes ongoing (as of writing) in Canada, an unratified deal for US west coast ports and unresolved negotiations in the parcel carrier sector.
Second is the weather, and specifically restrictions to shipping operations via the Panama Canal. While the worst-case draft restrictions have yet to be implemented, they are lower than in the past and require reduced loadings. The number of shipments has been limited. Reduced Panama Canal flows should increase demand for shipping into the US west coast.
This article was published by S&P Global Market Intelligence and not by S&P Global Ratings, which is a separately managed division of S&P Global.
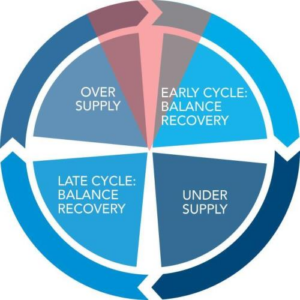
The transportation market begins the transition to a new market cycle
Steve Raetz Director of Research and Market Intelligence, C.H. Robinson
Today’s truckload market is starting to transition into a new market cycle: The Balance Recovery Phase. During this time, the market recovers and there is balance between supply and demand.
Unfortunately, there is no clear transition defined by an index for when this occurs; but rather behaviors in the market and shifts in market tension from loose to increasingly balanced inform us of what’s happening.
Supply (Drivers and Equipment)
Demand/Freight
~12,624 carriers lost YTD June
-2% to -0.1% forecasted growth in truckload volume Y/Y 2023
Truckload volume forecasts for 2023 vary by analyst
Long haul trucking jobs:
8,800 lost jobs in Q1 2023
Publicly traded trucking companies reported 1.6% fewer active tractors in Q1 2023
Analysts suggest freight downturn is seen as late in the market cycle
Volume increases needed address destocking and lower inventories
Carriers lost is a reasonably proxy for impact to Owner Operator capacity
Bureau of Labor Statistics long haul trucking jobs, seasonally adjusted is an indicator of trucking job staffing at payroll based trucking fleets. Q2 figures are still preliminary.
The trucking experience in the second half of 2023 will continue to lack notable tension on a national level due to the oversupply in the marketplace. However, with extremely low spot market pricing coupled with the continued loss of small carriers, the market will continue to move into the early cycle of recovering balance between supply and demand. It’s vital to plan and forecast for trucking in the second half of the year now to prepare for what’s coming. Reach out to C.H. Robinson or check out their latest North American Freight Market Insights report for truckload expertise and decision support to achieve optimal performance in any market phase.
Explanation of terms
Middle Market Business Index
In partnership with the U.S. Chamber of Commerce, RSM has collected data on middle market firms since 2015 through quarterly surveys conducted by The Harris Poll. The RSM US Middle Market Business Index provides a leading measure on the performance of businesses that make up the heart and soul of our country’s economy.
Industrial real estate vacancy rates
Industrial real estate vacancy rate is the percentage of available industrial property, such as a warehouse or distribution center.
United States regional divisions
Midwest
East North Central: Illinois, Indiana, Michigan, Ohio, and Wisconsin
West North Central: Iowa, Kansas, Minnesota, Missouri, Nebraska, North Dakota, and South Dakota
Northeast
New England: Connecticut, Maine, Massachusetts, New Hampshire, Rhode Island, and Vermont
Middle Atlantic: New Jersey, New York, Pennsylvania
South
South Atlantic: Delaware, Florida, Georgia, Maryland, North Carolina, South Carolina, Virginia, Washington DC, and West Virginia
East South Central: Alabama, Kentucky, Mississippi, and Tennessee
West South Central: Arkansas, Louisiana, Oklahoma, and Texas
WarehouseQuote’s economic commentary disclaimer
The material and content used in this publication is for informational purposes only. Reference to any third party (including external hyperlinks) does not constitute or imply the endorsement of said third party. WarehouseQuote does not warrant the accuracy or completeness of the Content. The views and opinions expressed herein are those of the author and do not necessarily reflect the official policy or position of WarehouseQuote. Reproduction of the Content may be made only with the written permission from WarehouseQuote.
Chris Rogers Head of Supply Chain Research, S&P Global Market Intelligence
Steve Raetz Director of Research and Market Intelligence, C.H. Robinson
About WarehouseQuote
WarehouseQuote is a managed warehousing solution helping middle market and enterprise businesses scale their warehouse operations with precision. Through our 3PL warehousing and fulfillment network of 250+ facilities, integrated technology platform, and in-house supply chain expertise, we enable businesses to design efficient fulfillment networks connected by a single technology platform. Hundreds of B2B and B2C businesses like Chatime, Joyride, Benitago Group, Big Ass Fans, and Mighty Good Solutions use WarehouseQuote to scale, streamline, and optimize their warehouse operations.