Executive Summary
- 3.2 percent national industrial vacancy rates
- 12.0 percent increase in Northeast warehouse storage pricing in Q3 vs Q2
- 138.5 index reading for the RSM Middle Market Business Index
Northeast 3PL storage rates surge from the diversion of trade in the third quarter. Read the full Q4 2022 report.

The United States industrial vacancy rate remains at 3.2 percent. The West region remains the tightest out of all markets at 2.4 percent followed by the Northeast at 2.9 percent. The Midwest and South have slightly higher vacancy rates at 3.4 and 3.5 percent. Yet, both regional markets have been contracting over the last four quarters.
In the short-term, low industrial real estate vacancy rates will continue to keep third-party warehousing capacity at a premium. Mid-term, more industrial real estate will become available in port markets in the first half of 2023. This will provide some relief for both warehouses and shippers. Q3′ 2022 data from WarehouseQuote’s Warehouse Pricing Index (WPI) shows East
Coast port container volumes are elevating warehouse storage rates. The Northeast region saw a 12.0 percent increase in pricing in Q3 2022 vs. Q2 2022. The West and Southwest markets saw slight pullbacks in pricing, but remained elevated. The Inland Empire vacancy rate remains at 0.6 percent. Los Angeles/Long Beach sits at 1.0 percent followed by Reno and Las Vegas at 0.8 and 1.4 percent. Also, many big box retailers continue to struggle with excess inventory.
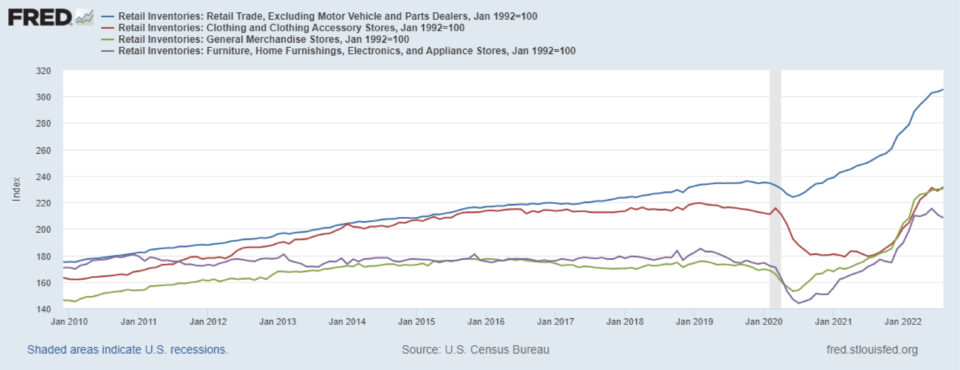
August’s Retail Inventories excluding Motor Vehicle and Parts Dealers index reading sits at 305.5, up +11.3 percent since January 2022. At the sector level, Retail Inventories for Clothing and Clothing Accessory Stores are up +15.2 percent since January 2022. Followed by Retail Inventories for General Merchandise Stores and Furniture and Appliances Stores up +12.8 percent and +4.7 percent since January 2022, respectively.
ABOUT MMBI
The RSM US Middle Market Business Index provides a leading measure on the performance of businesses that make up the heart and soul of our country’s economy. A reading above 100 for the MMBI indicates that the middle market is generally expanding; below 100 indicates that it is generally contracting. The distance from 100 is indicative of the strength of the expansion or contraction.
Of MMBI respondents with inventory, 48 percent said they are carrying more inventory in Q3 2022, up from 39 percent in Q2 2022. 55 percent of those surveyed see their businesses stockpiling more goods over the next six months. Yet, the logistics strategy deployed from retailers has varied. Some have chosen to provide steep price markdowns while others have implemented
pack n’ hold strategies.
Mike Adkins, VP of Sales at WarehouseQuote and Steve Raetz, Director of Research and Market Intelligence at C.H Robinson discuss this topic, warehousing capacity, and more in our new podcast series, Supply Chain Unpacked.
But, excess inventory issues still remain. Now, it seems that we may have another issue at hand: tapered consumer demand.
According to WarehouseQuote research, we’ve seen a 33 percent decrease in outbound warehouse shipments to retailers year-over-year. “Fewer products are being moved out of warehouses to go into stores. Leading to less warehouse space available for incoming orders.” Jordan Brunk, CMO of WarehouseQuote. In the latest article from CNBC’s State of Freight, Lori Ann LaRocco highlights that many retailers are utilizing 53-foot trailers for short-term storage as an alternative to warehousing. Commodities mentioned include tires, furniture, unsorted returns and other less critical items.
It is evident this year’s retail peak season may look differently than previous years. More inventory will continue to hit the ports in the coming months. In the Gulf, the Port of Houston recently announced it was considering an “excessive dwell fee” on containers that stay longer than the free time allowed at the terminal. The port posted historic volumes processed in August (CNBC).
With record-low warehousing capacity, consumer pullback, and more inventory hitting the ports soon, the question still remains – where will all this inventory go?
The Warehouse Pricing Index (WPI) is powered by service fees across our global network for ambient warehousing services. We’ve started by defining a baseline in Q1’ 2021 and looking at changes in costs relative to the average price of the service (storage, pallet-in, and pallet-out costs) and filtering out the upper and lower 5 percent percentiles. Market insights are obtained through interviews with partners from within our agile warehouse network.
The Northeast market saw the highest increase in storage rates at (+12 percent) in Q3 2022 vs Q2 2022. The diversion of trade from the West coast to the NY/NJ and Savannah ports has increased warehouse storage pricing. The Southwest and West regions saw a (-9.7 and -7.8 percent) decrease in storage rates in Q3 2022 vs Q2 2022. It’s important to note this doesn’t indicate warehouse storage is cheaper. Southwest and West region storage rates are still at a premium but have receded, most likely from the diversion of trade. Midwest region storage rates have increased by (+5.2 percent) in Q3 2022 versus Q2 2022. The increase in Midwest storage prices could be indicative of customers retracting from distributed models to mitigate the risk of losing space in coastal markets due to low inventory levels. This was a concern mentioned in the Q3′ 2022 WPI report.
C.H. ROBINSON’S VIEW ON THE STATE OF THE TRUCKING MARKET
Steve Raetz – Director of Research and Market Intelligence, C.H. Robinson
If you’re a shipper, you’ve been questioning the current state of the full truckload and less-than truckload markets. C.H. Robinson, an industry leader in global logistics, weighs in on the state of trucking market in their October North America Freight Market Insights report.
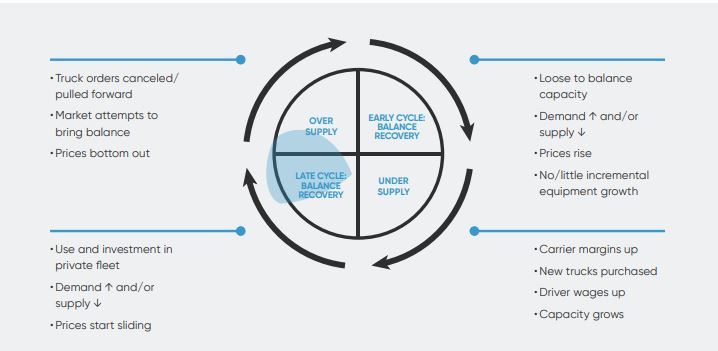
“According to C.H. Robinson analysis, today’s market is well supplied, but it’s not to a point of over supply – yet. Class 8 tractor purchases are forecasted by ACT Research at a net 4% fleet growth for 2022 y/y. This fleet growth with decelerating freight volume growth forecasts will likely net an oversupplied market in mid first half of 2023.” It’s a matter of ‘when’. The trucking market cycle is inevitable and will continue to go through levels of over and under supply as a result of market forces. Each cycle is unique and presents its own set of challenges. Below, we show a table illustrating the expected forces and new factors to the 2022 experience.
The material and content used in this publication is for informational purposes only. Reference to any third party (including external hyperlinks) does not constitute or imply the endorsement of said third party. WarehouseQuote does not warrant the accuracy or completeness of the Content. The views and opinions expressed herein are those of the author and do not necessarily reflect the official policy or position of WarehouseQuote. Reproduction of the Content may be made only with the written permission from WarehouseQuote.
The contents of this report are made available for informational purposes only and should not be relied upon for any legal, business, or financial decisions. Flexport does not guarantee, represent, or warrant any of the contents of this report because they are based on our current beliefs, expectations, and assumptions, about which there can be no assurance due to various anticipated and unanticipated events that may occur. This report has been prepared to the best of our knowledge and research; however, the information presented herein may not reflect the most current regulatory or industry developments. Neither Flexport nor its advisors or affiliates shall be liable for any losses that arise in any way due to the reliance on the contents contained in this report.


WarehouseQuote is a managed warehousing solution helping middle market and enterprise businesses scale their warehouse operations with precision. Through our 3PL warehousing and fulfillment network of 250+ facilities, integrated technology platform, and in-house supply chain expertise, we enable businesses to design efficient fulfillment networks connected by a single technology platform. Hundreds of B2B and B2C businesses like Chatime, Joyride, Benitago Group, Big Ass Fans, and Mighty Good Solutions use WarehouseQuote to scale, streamline, and optimize their warehouse operations.