Market Update: Q3′ 2022 Warehouse Pricing Index report
Jacob Roseburrough Director of Marketing
Executive Summary
The Southwest Region Index saw a 19 percent increase in monthly stackable storage rates in Q2′ 2022 vs. Q1′ 2022
The Midwest Region Index saw a 12 and 15 percent decrease in handling costs in Q2′ 2022 vs Q1′ 2022
he U.S. 3PL Market outlook remains strong amidst uncertain economic conditions
NOAA predicts of 65 percent chance of an ‘above-normal’ Atlantic hurricane season
3PL capacity remains limited due to global congestion, with an average market vacancy rate of 3.5 percent nationwide
What the uncertainty of the U.S. economy means for the 3PL warehousing market
In June, the Consumer Price Index (CPI) of All Items increased 9.1 percent on a 12-month percentage change basis, exceeding May ‘22, the highest year-over-year change in 41 years. This included a 10.4 percent increase in food, 41.6 percent increase in energy, respectively. Fuel and gas prices also continued to soar across the United States. On June 14th, the national average gasoline price reached $5.02 a gallon but has since receded to $4.52 a gallon.
According to the FRED and the University of Michigan, consumer sentiment tumbled to 50.0, down 14.4 percent month-over month and the lowest rating since April 1980. With rising variable prices and uncertain economic conditions, what does this mean for the U.S. 3PL warehousing market?
Our perspective
The overall price of warehousing service will continue to increase and operators are becoming even more selective on who they choose to work with. Here are a few reasons why:
The increase in labor, insurance, taxes, and industrial real estate rent will all drive rates higher.
3PL’s have consolidated their efforts to large volume customers. Even with this consolidation, occupancy is still at record-highs. Therefore, there is limited downside pressure on rates.
As we saw in 2008, “Even as sales and revenue tracked somewhat downward in 2007, 3PL’s had more luck finding customers this year”. This increase in customer demand will either keep rates elevated or continue to drive rates higher in the short term.
Short term outlook
Today, the U.S. national industrial vacancy rate sits at just below 3.5 percent and closer to 1 percent in inland port markets. Nationwide capacity constraints coupled with the increased costs of rent, labor, energy, and packaging will significantly impact the overall cost of warehouse services. According to Cushman and Wakefield’s first quarter report, asking rents for the industrial tier 1 markets like the Inland Empire are up 41 percent and 16 percent nationally, year-over-year. There is also 660 million new square feet of industrial space expected to enter the market in 2022, which would accommodate 4 percent of the total inventory at 16 billion square feet.
Year-over-year, the average annual hourly earnings for Transportation and Warehousing employees is up 5 percent. The cost of pulp and paper used for packaging is up 22 percent. Energy and fuel costs were also up 42 percent and 60 percent, respectively. Based on feedback we’ve received from both economists and third-party operators within our network, we expect all market drivers to continue to increase for the foreseeable future, leading to an increase in warehousing and storage services.
We also expect operators to be more selective on who they choose to work with and move out smaller, less profitable customers. In early Q2, the WarehouseQuote team had conversations with network partners in the Northeast market. One facility in particular mentioned that both they and many operators around the area will not entertain anything less than 1,000-1,500 pallets per month. This is slightly concerning for the small and middle market segments, especially since hearing recent demand planning woes from big box retailers.
Big box retailers can slash prices on select durable goods and seasonal items and move on. The effects of poor demand planning for a small-to-medium-sized business could be catastrophic. Tapering consumer demand and elevated inventory levels will force many to decide to either liquidate or find a third-party facility to store inventory overflow. If you choose the latter, you must be aware of the current market’s pallet thresholds mentioned above. Anything less, you will probably need to increase your radius tolerance into tertiary markets before finding a provider with readily available warehousing capacity that will accept your product.
On the other hand, if you’re a small-to-medium sized business with just a few hundred pallets distributed across several network locations, it might be time to consider consolidating your inventory. This could help mitigate the risk of your third-party provider forcing you to move out for a larger customer. One of the downsides of consolidating inventory to a single distribution point is the potential for loss of customers within the 1-2 day shipping window. In that case, we would highly recommend selecting a centrally located warehouse to provide the maximum 2-day shipping coverage from a single distribution point.
Long term outlook
The 12-18 month market outlook on the 3PL market is cloudy with a chance of prolonged supply and demand gaps. On June 16th, The Federal Reserve increased the funds rate by 75 bps to 1.5-1.75 percent after the inflation rate unexpectedly accelerated last month. The main objective is to increase the cost of credit making loans more expensive for businesses and consumers. This typically slows down productivity and overall economic activity resulting in people spending less and reducing the supply of money in circulation. All in all, this strategy is being used to ‘cool down’ the economy. During the announcement, Fed Chair Powell also said “We anticipate that ongoing rate increases will be appropriate.”
However, the United States industrial real estate is currently underserved with already a number of obstacles to get buildings entitled and stood up to support demand. The federal reserve raising higher interest rates adds yet another obstacle and could potentially scare off some industrial developers. Leading to a reduction in market productivity and the amount of new industrial warehousing space being built over the course of the next 24-months. However, 660 million square feet of industrial space is expected to enter the market by the end of 2022. Only time will tell if the additional capacity will be enough to support the market or if we will experience pro-longed supply and demand gaps.
How did the 3PL Market Fare in the ‘08 Financial Crisis?
Based on our findings, the sector performed moderately well. The positive side is that in times of economic downtown, more companies tend to outsource their supply chain operations to control costs and downsize operational headcount. The negative side is that with tapering consumer demand, some companies might produce less inventory resulting in less revenue for third-party logistics providers. Fortunately, it seems the reduction in consumer demand is isolated to certain durable goods and seasonal items. We will be closely monitoring consumer expenditures and sentiment for all industries and report on any major fluctuations in the coming months. All in all, as long as the third-party logistic providers can save their customers money they will do just fine. This is one of the reasons why the on-demand warehousing model is so attractive in today’s economic landscape. The purchase of industrial real estate requires extensive capital and operational expenditure including equipment and labor. Instead, businesses can utilize flexible warehouse networks like WarehouseQuote to navigate today’s economic landscape while keeping cash on-hand, control costs, and drive operational efficiency.
“Even as sales and revenue tracked somewhat downward in 2007, 3PLs had more luck finding new customers this year, with 56 percent growing their customer base by 10 percent or more, compared to 54 percent in 2007.” – 3PL PERSPECTIVE 2008, INBOUND LOGISTICS
Q3′ 2022 Warehouse Pricing Index data
Data Methodology
The Warehouse Pricing Index (WPI) is powered by service fees across our global network for ambient warehousing services. We’ve started by defining a baseline in Q1’ 2021 and looking at changes in costs relative to the average price of the service (storage, pallet-in, and pallet-out costs) and filtering the upper and lower 5 percent percentiles. Market insights are obtained through interviews with partners from within our scalable warehouse network.
National Warehousing Pricing Index
Q2’2022 vs. Q1′ 2022 stackable warehouse storage
Southwest region – +19%
West region – +17%
Northeast region – +6%
Midwest region – -2%
Southeast region – -4%
In Q2’ 22, the Southwest Region saw a 19 percent increase in stackable storage pricing versus Q1’ 22, respectively. This is largely due to the diminished capacity in the West Coast market. Cargo that had historically been managed in CA was funneled into alternative locations like Arizona and Texas, creating rate surges across the region.
Flexport’s view of the state of inventories
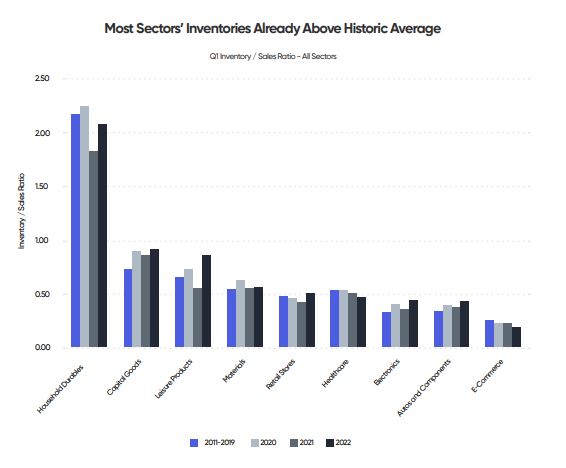
Trade flows and warehouse demand depend critically on whether retailers and manufacturers choose to rebuild inventories or to stay lean. A rebuild would boost demand for logistics services. Yet, corporate inventories, expressed as a ratio of sales, are already above pre-pandemic levels in six out of nine sectors with the notable exception of e-commerce.
As a digital freight forwarder, Flexport has visibility into global transport, including the state of goods flowing into industrial and retail inventories. A key challenge for supply chains during the period of elevated demand for consumer goods during the pandemic has been in holding enough stock of the right products. With warehouses full to the brim it’s worth asking whether corporate inventories are yet back to pre-pandemic levels and whether there is a variance by sector.
We’ve carried out an analysis of over 1,400 firms using corporate financial data and found that the inventory/sales ratio for the group – a key measure of inventory adequacy – reached 0.49x in Q1’22 versus 0.46x in Q1’21 and an average for 2011 – 2019 of 0.50x.
Drilling down to the sector level, as shown in the chart above, shows that six of the nine major sectors tracked by Flexport already had an inventory to sales ratio in Q1 ‘22 that was above the average for Q1 in the 2011-2019 period. In the case of leisure products (e.g. toys, outdoor and fitness equipment) and electronics (computing, telecoms and components) ratios were already 25% higher than the pre-pandemic period.
For the retail sector there is a marked spread between store and non-store (i.e., e-commerce retailers). For e-commerce, specifically, the inventoryto-sales ratio of 0.20x remains well below the 0.25x pre-pandemic levels. For physical retailers the picture is very different, with apparel and food stores already well above pre-pandemic levels while multiline and specialty retailers are within striking distance of historical norms.
The next stage will be for firms to decide whether to return to pre-pandemic inventory strategies, or whether to double down on just-in-time (i.e. leaner inventories than historically) or shift to just-in-case (i.e. fatter inventories) approaches. We’ll be watching the data closely for clues.
C.H. Robinson’s Perspective on the Atlantic Hurricane Season
Forecasters at NOAA’s Climate Prediction Center, a division of the National Weather Service, are predicting above-average hurricane activity this year—which would make it the seventh consecutive above average hurricane season. NOAA’s outlook predicts a 65 percent chance of an above normal normal season, 25 percent chance of a near-normal season, and a 10 percent chance of a below-normal season.
For the 2022 hurricane season, For the 2022 hurricane season, NOAA is forecasting a likely range of 14 to 21 named storms (winds of 39 mph or higher), of which 6 to 10 could become hurricanes (winds of 74 mph or higher), including 3 to 6 major hurricanes (category 3, 4 or 5; with winds of 111 mph or higher). NOAA provides these ranges with a 70% confidence.
How to prepare your supply chain for this year’s hurricane season
Plan inventory carefully. Consider placing inventory where it will face less disruption should flooding or electricity services suffer.
Automate low volume lanes. Consider a digitally enabled spot market strategy to help overcome disruption while reducing work and minimizing cost increases.
Check in regularly. Schedule regular logistics planning meetings and include key/core transportation suppliers.
Plan for vulnerable areas. Be mindful of LTL and intermodal terminal locations in areas vulnerable to an approaching hurricane so you have an alternative if service outages occur.
Leverage an agile warehouse network, like WarehouseQuote, to provide your business with the flexibility to move product on-demand with precision and real-time visibility.
The material and content used in this publication is for informational purposes only. Reference to any third party (including external hyperlinks) does not constitute or imply the endorsement of said third party. WarehouseQuote does not warrant the accuracy or completeness of the Content. The views and opinions expressed herein are those of the author and do not necessarily reflect the official policy or position of WarehouseQuote. Reproduction of the Content may be made only with the written permission from WarehouseQuote.
Flexport disclaimer
The contents of this report are made available for informational purposes only and should not be relied upon for any legal, business, or financial decisions. Flexport does not guarantee, represent, or warrant any of the contents of this report because they are based on our current beliefs, expectations, and assumptions, about which there can be no assurance due to various anticipated and unanticipated events that may occur. This report has been prepared to the best of our knowledge and research; however, the information presented herein may not reflect the most current regulatory or industry developments. Neither Flexport nor its advisors or affiliates shall be liable for any losses that arise in any way due to the reliance on the contents contained in this report.
Steve Raetz Director of Research and Market Intelligence, C.H. Robinson
Chris Rogers Head of Supply Chain Research, S&P Global Market Intelligence
Jacob Roseburrough Director of Marketing
About WarehouseQuote
WarehouseQuote is a managed warehousing solution helping middle market and enterprise businesses scale their warehouse operations with precision. Through our 3PL warehousing and fulfillment network of 250+ facilities, integrated technology platform, and in-house supply chain expertise, we enable businesses to design efficient fulfillment networks connected by a single technology platform. Hundreds of B2B and B2C businesses like Chatime, Joyride, Benitago Group, Big Ass Fans, and Mighty Good Solutions use WarehouseQuote to scale, streamline, and optimize their warehouse operations.