The national industrial real estate vacancy rate eclipses 5.8%. Warehouse services flatline. Inventory levels rise. New disruptions emerge.
Jacob Roseburrough Director of Marketing
Executive Summary
+0.5%increase in the national average of warehouse storage costs year-over-year in Q1 ’24 vs Q1’23, with a -0.6% decrease quarter-over-quarter
The national average of warehouse storage costs has decreased slightly over four consecutive months: a first, since the WPI has been published
The Midwest region led the U.S with 4.4% increase from Q1’23 to Q1’24
Logistics Managers’ Index Inventory Levels hit 63.8, marking the highest point since October 2022
Consumer Sentiment is up 28.1% year-over-year ending in March, according to the University of Michigan’s Index of Consumer Sentiment
RSM’s Q1’24 Middle Market Business Index (MMBI) eased slightly in Q1’24 to 130.8 (-1.4 index points)
The Warehouse Pricing Index is now available in Journal of Commerce’s extensive, multi-channel dashboard, Gateway. Learn more about the Gateway and how WarehouseQuote is helping supply chain managers make confident supply chain decisions.
The National Industrial Real Estate Vacancy Rate Eclipses 5.8%. Warehouse Services Flatline. Inventory Levels Rise. New Disruptions Emerge.
The state of U.S. 3PL warehousing has been quiet over the last 12 months with marginal year-over-year increases in warehouse services prices (+0.5%). After a year’s worth of destocking efforts, many warehouse operators have an ample amount of available capacity for the first time since 2020. Though pricing has fallen slightly over the past four months, signals are beginning to emerge throughout the supply chain that indicate warehouse services pricing may increase in the quarters ahead.
(Logistics Managers' Index, Inventory Levels)
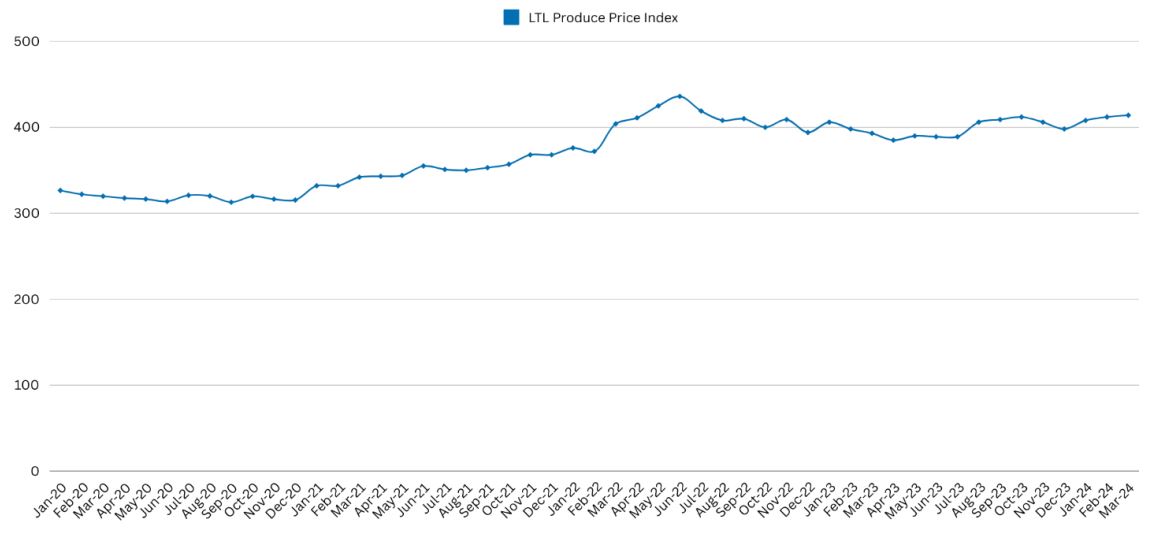
Inventory Levels had been down in 7 out of the last 8 months up until the first quarter of 2024. Fast forward to March ‘24, we’ve now seen three straight months in a state of expansion with the index hitting 63.8 in March 2024, up (+18.5) index points from December 2023. However, data from S&P Global Market Intelligence suggests this may be short lived as container shipping rates have steadily decreased since January.
Consumer Sentiment
The University of Michigan's Index of Consumer Sentiment rose to 79.4 in March 2024, up 28.1% from March 2023. This is a positive sign for businesses as they start to build back up inventories.
Labor Costs
The Average Hourly Earnings of All Employees, Transportation and Warehousing, are up 6.4% from March 2023. The cost of labor plays a significant role in the price of warehouse services. As hourly earnings rise, this will continue to apply upward pressure to warehouse services pricing.
Warehousing Market Watch
5.8%National Industrial Vacancy Rate
3 Consecutive Months of increase in Inventory Levels
We have now seen Inventory Levels in 3 consecutive months of expansion, according to the Logistics Managers' Index
6.4% Year-over-year increase in the Average Hourly Earnings of Warehousing Employees
National Warehouse Pricing Index
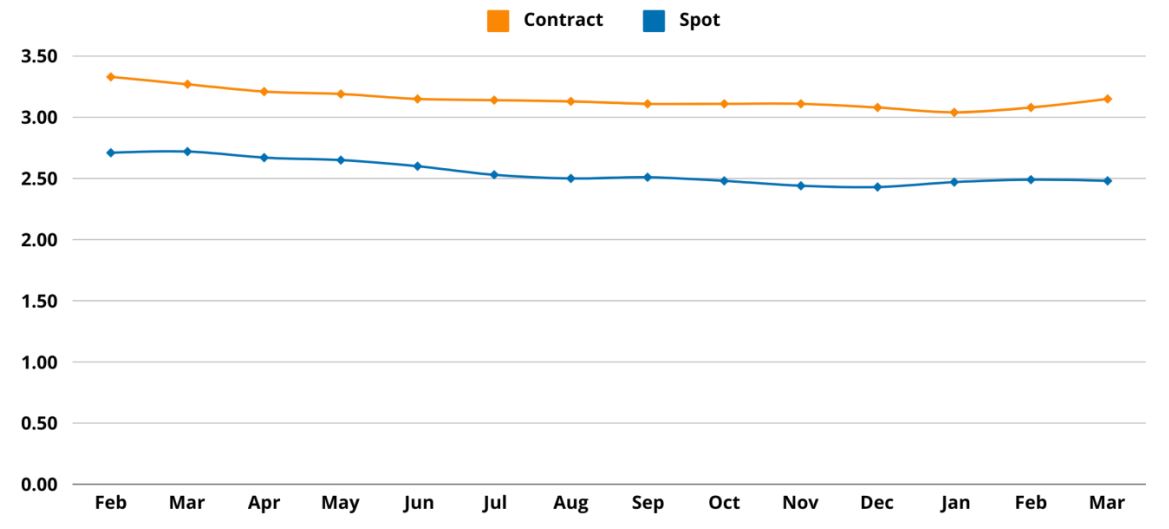
The National Warehouse Pricing Index (WPI) increased marginally in Q1 '24 vs Q1’23, up 0.5 percent year-over-year. It seems we are starting to see pricing stability after several years of consistent increases in warehouse storage services pricing.
Regional Warehouse Pricing Index
The Midwest region leads all regions with a 4.4 percent year-over-year increase in warehouse storage services pricing. The West has seen a marginally year-over-year increase of 1.5 percent as more import cargo has been diverted back to the US West Coast. South and Northeast regions have seen 1.2 and 1.4 percent reductions in the average cost of warehouse services pricing year-over-year.
The voice of WarehouseQuote
“As consumer confidence rebounds and warehousing costs remain steady, businesses are poised to capitalize on a window of capacity before the traditional peak inventory season. Proactive preparation and strategic analysis now will position companies favorably as capacity becomes constrained.” - Patrick Winkler, VP of Sales at WarehouseQuote
Exclusive Commentary from S&P Global Market Intelligence, C.H. Robinson, and MyFreightWorld
Climbing The Peak: Prospects for US Supply Chains Heading into Peak Season
Chris Rogers Head of Supply Chain Research, S&P Global Market Intelligence
Supply chains have had a stellar start to 2024, with a boom in trade activity despite all the disruptions caused by violence in the Red Sea, water shortages in the Panama Canal and the tragic Francis Scott Key Bridge in Baltimore. The rest of the year won’t necessarily be the same, particularly given the uncertainties surrounding the peak shipping season.
US seaborne imports climbed by 15% year over year in the first quarter of 2024. Growth was driven by industrial sectors including materials ranging from steel to paper, which increased by 20%. Consumer goods shipments increased by a more modest 8%, with home and personal care rising by 16% while consumer electronics and apparel increased by just 3% and 6% respectively.
Some caution is needed: imports a year ago were depressed by inventory destocking in the retail sector. S&P Global Market Intelligence forecasts call for the growth in US containerized freight imports to slow to 7% in the second quarter and 3% in the fourth quarter, mostly down to slowing growth from the materials sector while apparel is expected to remain lackluster.
The steady decline in container shipping rates from their January peaks perhaps indicates an expectation from market participants that the good times may not continue through the whole year.
There are also considerable uncertainties surrounding the timing of peak season shipments resulting from a mixture of physical, political and labor reasons. That can cause challenges for both cargo owners and logistics network operators and may lead to earlier-than-normal shipments to mitigate delivery risks.
The temporary closure of the port of Baltimore may prove to be more a regional than national challenge, raising the prospect of elevated shipments into nearby ports including Philadelphia, Norfolk and Newark among others. The US Army Corps of Engineers has stated the port could be fully reopened by May, reducing risks during the peak shipping season.
The interruptions to shipping to the US east coast via the Red Sea are being mitigated by renewed shipping via the Panama Canal by the major liners. At a minimum, though, importers to the US east coast will either need to pay higher costs (for the Panama Canal or cross-country rail) or ship up to two weeks earlier (if following the Cape of Good Hope route).
A further uncertainty comes from negotiations between east coast port unions and employers to sign a new pay deal before Sept. 30, 2024. Again, shippers may either ship early or via alternative routes including the west coast.
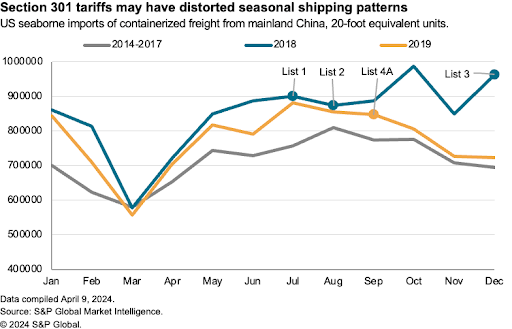
Activity late in the peak season is in part a function of politics. Depending on the outcome of the US elections, there’s potential for significantly higher tariffs on imports from China. Cargo owners will need to consider a range of strategies including pulling forward imports from the first quarter of 2025, sharing the cost of tariffs with suppliers and customers and rethinking their sourcing patterns.
The imposition of tariffs on imports from China in a series of lists between July 2018 and September 2019 led to significant shipping distortions. The initial round of tariffs in July and August 2018 likely led to an earlier-than-normal seasonal peak in 2018, while the extension to a wider range of products in early 2019 likely drove a 23% surge in US seaborne imports in December 2018.
The State of Ground Transportation, Produce Season, and Cross-border Trade
Mathew Leo Principal Manager, Research and Market Intelligence, C.H. Robinson
There are two similar, yet distinct factors of timing involved within the U.S. for-hire truckload industry, cyclicality and seasonality. Cyclicality is defined by the four market cycles that we inevitably churn through as the market works to find balance between the amount of freight demand and the amount of carrier supply.
This cycle is dependent upon many factors but typically lasts approximately three years, despite this current market cycle lasting much longer due to a prolonged period of over-supply. Seasonality on the other hand is defined by the reoccurring situations that we see repeated each calendar year. These seasonal events could be very regimented events that we can set our watch to, like holidays.
They can also be events that we have a good idea that they will occur, but the timing of the event isn’t quite as predictable, like a winter storm. Both the predictable and unpredictable events are plannable; however, because we can use the learnings of the past in order to forecast the impact of said events when they arise and enact those plans to limit their effects on service and/or pricing.
Possibly the largest plannable, seasonal disruption is Produce Season. Produce Season is when fresh fruits and vegetables begin to be harvested and shipping volumes surge. It begins every year each spring as temperatures rise. In the U.S., naturally it begins in Southern states, traditionally in late March/early April, and moves North through Summer and into the fall months. With Mexico being further South, harvesting of those crops begins slightly before it does in the U.S.
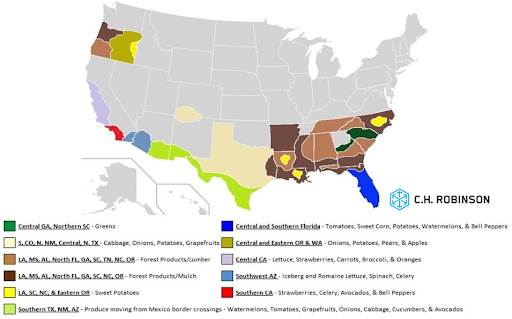
As the weeks progress, and warmer weather pushes north, more regions begin shipping produce and the volumes available increases as well. This creates a two-pronged impact; freight demand increases despite the same amount of carrier supply, and due to the nature of the commodities, this freight needs to move with urgency to maintain freshness. This means that produce tends to move at a premium compared to standard freight in order to secure a truck, and due the imbalance of supply and demand to begin with that means that there will be even less remaining truck availability. Here is a map of the United States highlighting where specific commodities will start to increase shipment volume outbound during the month of April.
The key to maintaining high service levels and low costs during this time when shipping out of impacted regions is to provide as much lead-time as possible, and if your shipment doesn’t necessarily have to move on a specific day to allow for multiple pickup days (a pickup window). This flexibility will go a long way. Keep in mind that while most produce commodities due ship in a refrigerated van, that this produce season tends to impact both temperature-controlled trucking as well as dry van. This is because refrigerated trucks also participate in the dry van market, with the refrigeration unit turned off. As produce season ramps up, these additional trailers are less available to haul dry goods, and thus contributes to the imbalance of supply and demand in the dry van market. Another thing to consider is the other side of the coin, which is freight moving inbound towards these growing regions. With abundant demand in these growing regions, carriers often have an increased desire to ship into the area and may take freight at a lower rate in the spot market to position their trucks there.
As mentioned, the harvesting of produce first begins out of Mexico due to the warmer weather. From an export standpoint, fruits and vegetables are a top 5 export from Mexico to the United States. The top export is vehicles and related automotive parts. Over the past decade, the Texas-Mexico Automotive Supercluster (TMASC) has rapidly become North America's top hub for vehicle production, experiencing a 55% expansion in vehicle production.
Joint investments by assembly companies and their suppliers in the region have fueled this growth across Texas and Mexico. Upcoming facilities from Tesla, Bobcat, and others coupled with new Original Equipment Manufacturers (OEMs) in Nuevo León and Coahuila, are helping drive TMASC's expansion. Moreover, TMASC is attracting investments in cutting-edge technologies, positioning the region as an automotive innovation leader. Mexico's nearshoring trend and substantial Foreign Direct Investment (FDI) inflows have further solidified its global prominence in the automotive landscape. Mexico has re-entered the top 25 countries attracting FDI due to nearshoring and the relocation of companies from Asia and other countries to Mexico. The auto parts industry specifically is experiencing significant growth from nearshoring efforts, achieving its highest production level ever this January.
U.S. Manufacturing Output and its Impact on Transportation
Mike Chalfant President, MyFreightWorld
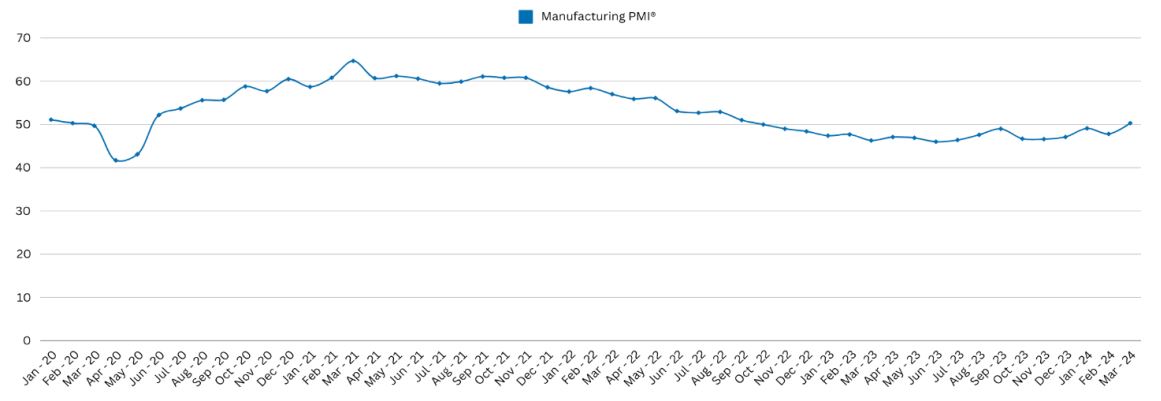
To best understand the current state of manufacturing in the United States, and its effect on Transportation, I think it’s helpful to look at key events of the last four years. When the Covid-19 pandemic arrived in early 2020, manufacturing took a brief pause, like many of us trying to determine best steps forward. It quickly rebounded in a large way, stringing together 29 months of growth – with tailwinds such as government stimulus going directly to U.S. citizens, Paycheck Protection Programs (PPP) aiding businesses of all sizes, historically low interest rates, and restrictions on travel and entertainment encourage people to spend their money on manufactured physical goods.
This consumer spending/manufacturing frenzy led to a large increase in transportation costs in all modes, which played a part in inflation rising so dramatically in 2021 and 2022. New baseline costs were set in Small Package and Less than Truckload, where there is a finite supply of available capacity due to the large barrier to enter both markets (think of the tractors/trailers/terminals/drivers/technology required to enter). New carriers flooded the larger Full Truckload market, getting into business with 1-3 trucks and drivers and enjoying historically high spot rates.
However, by this time inflation had clearly gotten out of hand. To combat this, the United States Federal Reserve went back to their Econ 101 textbooks and started increasing interest costs – which has proven effective.
The series of interest rate hikes from March 2022 to July 2023 led to a string of 16 months of decreasing manufacturing output, with the industry now facing headwinds of higher interest rates (which led to less capital spending) and a resurgence from the services industry.
The last interest rate hike was in July of 2023, so people have had time to adapt to a new normal per se, and in March 2024 we saw the first month of growth in the manufacturing sector since October 2022.
During this stretch of manufacturing decline and rising interest rates there has been a correction in the full truckload sector, with 88,000 trucking companies leaving the marketplace in the past 12-18 months. This latest increase is an encouraging sign for Full Truckload service providers, as they have navigated “basement level” spot rates for the past 20 months.
So, as we sit here today with one month of modest manufacturing growth, a new baseline set of Small Package/LTL rates in place, and very low Full Truckload rates available – how should shippers plan for the future?
It’s our viewpoint that Shippers will not see major increases to Small Package, LTL, or Full Truckload rates in 2024. There is still an oversupply of full truckload providers that will take a few more quarters to correct, and that along with continued growth in manufacturing will be needed to drive meaningful increases to current transportation costs. Shippers could continue to keep an eye on manufacturing output and cuts in interest rates by the Fed. There could be a point in time later this year/early next year where it’s wise to shift from the current low spot rates to attractive long term contract rates.
Explanation of Terms
Middle Market Business Index
In partnership with the U.S. Chamber of Commerce, RSM has collected data on middle market firms since 2015 through quarterly surveys conducted by The Harris Poll. The RSM US Middle Market Business Index provides a leading measure on the performance of businesses that make up the heart and soul of our country's economy.
Logistics Managers' Index
The LMI score is a combination of eight unique components that make up the logistics industry, including: inventory levels and costs, warehousing capacity, utilization, and prices, and transportation capacity, utilization, and prices. The LMI is calculated using a diffusion index, in which any reading above 50.0 indicates that logistics is expanding; a reading below 50.0 is indicative of a shrinking logistics industry.
Industrial Real Estate Vacancy Rates
Industrial real estate vacancy rate is the percentage of available industrial property, such as a warehouse or distribution center.
United States Regional Divisions
Midwest
East North Central: Illinois, Indiana, Michigan, Ohio, and Wisconsin
West North Central: Iowa, Kansas, Minnesota, Missouri, Nebraska, North Dakota, and South Dakota
Northeast
New England: Connecticut, Maine, Massachusetts, New Hampshire, Rhode Island, and Vermont
Middle Atlantic: New Jersey, New York, Pennsylvania
South
South Atlantic: Delaware, Florida, Georgia, Maryland, North Carolina, South Carolina, Virginia, Washington DC, and West Virginia
East South Central: Alabama, Kentucky, Mississippi, and Tennessee
West South Central: Arkansas, Louisiana, Oklahoma, and Texas
WarehouseQuote’s Economic Commentary Disclaimer
The material and content used in this publication is for informational purposes only. Reference to any third party (including external hyperlinks) does not constitute or imply the endorsement of said third party. WarehouseQuote does not warrant the accuracy or completeness of the Content. The views and opinions expressed herein are those of the author and do not necessarily reflect the official policy or position of WarehouseQuote. Reproduction of the Content may be made only with the written permission from WarehouseQuote.
Chris Rogers Head of Supply Chain Research, S&P Global Market Intelligence
Mathew Leo Principal Manager, Research and Market Intelligence, C.H. Robinson
Mike Chalfant President, MyFreightWorld
About WarehouseQuote
WarehouseQuote is a managed warehousing solution helping middle market and enterprise businesses scale their warehouse operations with precision. Through our 3PL warehousing and fulfillment network of 250+ facilities, integrated technology platform, and in-house supply chain expertise, we enable businesses to design efficient fulfillment networks connected by a single technology platform. Hundreds of B2B and B2C businesses like Chatime, Joyride, Benitago Group, Big Ass Fans, and Mighty Good Solutions use WarehouseQuote to scale, streamline, and optimize their warehouse operations.