Market Report: Q1’23 Warehouse Pricing Index Report
Retail inventories recede. Retail sales slump. Holiday sales soar. Read the full WarehouseQuote's Q1'23 Warehouse Pricing Index report.
Jacob Roseburrough Director of Marketing
Executive Summary
Retail Inventories recede 1.4 percent from August peak
November’s Retail Sales mark the largest drop in 11 months; yet holiday sales set all-time highs
50 percent of Q4 ‘2022 WarehouseQuote warehousing requests cited ‘capacity’ as the no.1 reason for needing warehouse space
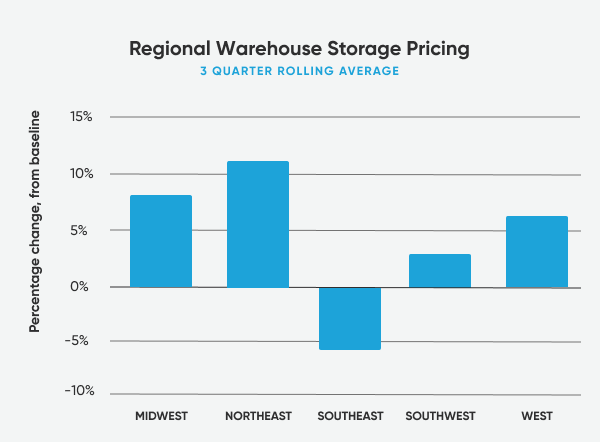
12 percent increase in Northeast warehouse storage pricing relative to the baseline
Are we currently experiencing a pullback in consumer demand or a shift to more value-driven commodities? We will look to answer this question with Flexport’s consumption forecast.
Warehousing demand drivers
Retail inventories recede. Retail sales slump. Holiday sales soar. The Q1’ 2023 Warehouse Pricing Index report provides clarity on retail inventories, sales, consumption, and warehouse storage and handling pricing with contributions from Flexport and C.H. Robinson. Let’s dive in.
Retail inventories
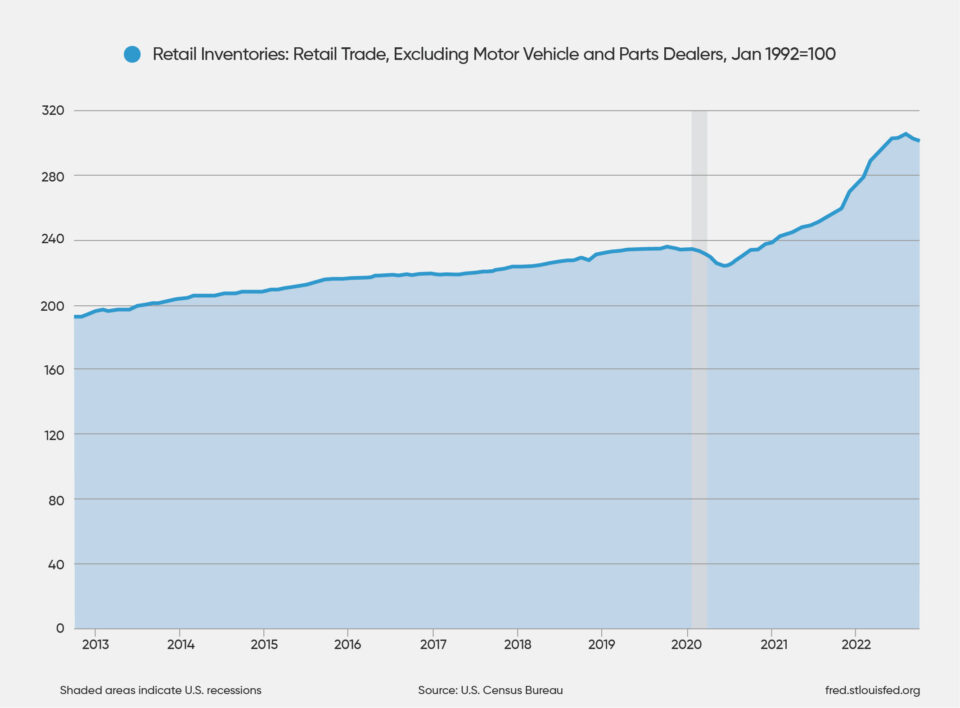
Retail Inventories: Retail Trade, Excluding Motor Vehicles and Part Dealers decreased for the second consecutive month, down 1.4 percent from August’s index reading of 305.7 and $551 billion worth of merchandise value.
Considerable markdowns coupled with early holiday shoppers have receded retail inventory levels. Nike recently reported a 1 percent decline in inventories and believe the peak is behind them.
“We believe the inventory peak is behind us as actions we’re taking in the marketplace are working.” John Donahoe, CEO of NIKE
Walmart also mentioned inventory level improvements citing grocery market share gains and strong digital sales growth in their Q3 earnings call.
“We significantly improved our inventory position in Q3, and we’ll continue to make progress as we end the year.” Doug McMillon, CEO of Walmart
However, we still have a ways to go before reaching ‘normal’ inventory levels. Retail Inventories remain elevated, up 17 percent in the last 12 months comparing data from October 2022 to October 2021.
Retail sales
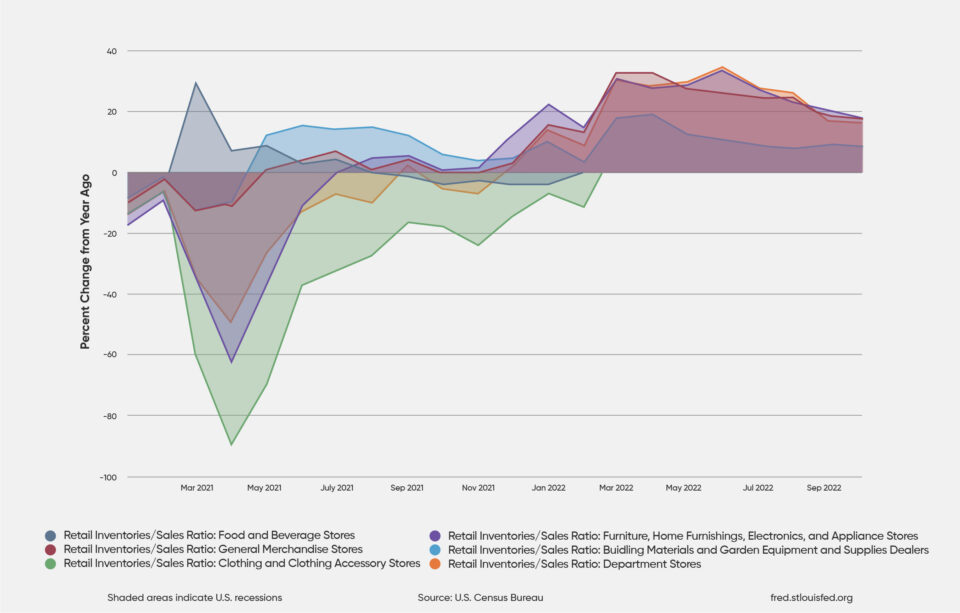
Furthermore, November’s Retail Sales, Inventories to Sales ratios, and Black Friday and Cyber Monday sales numbers are providing a mixed bag of interpretations.
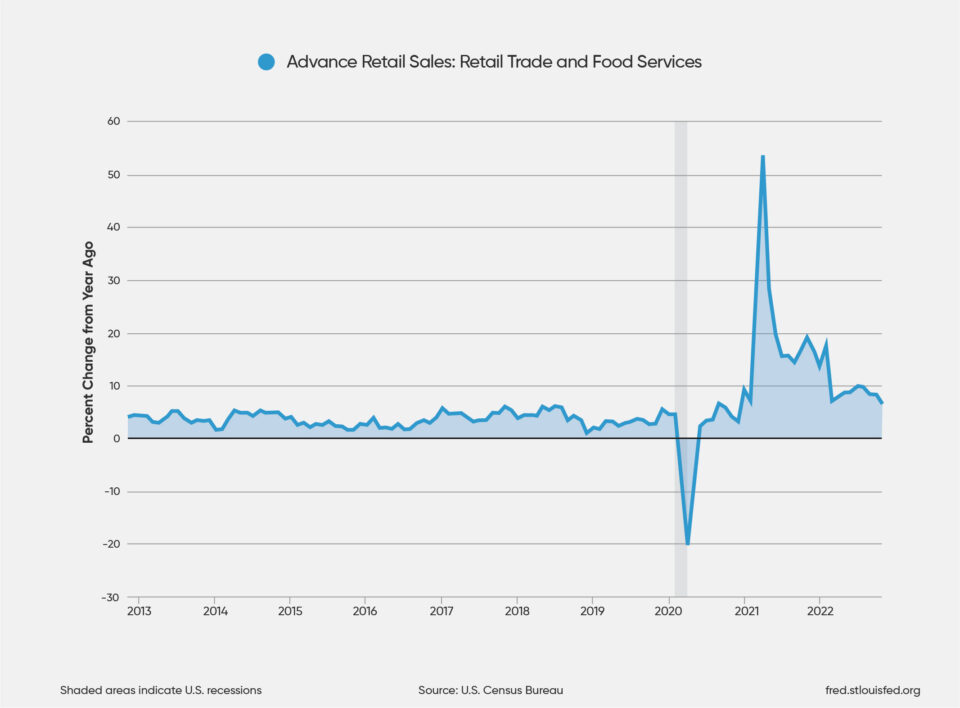
Advanced Retail sales: Retail Trade and Food Services declined 0.6 percent in November. This marks the biggest drop in retail sales in 11 months and can be seen across a majority of industry sectors.
The Electronic and Furniture sectors are seeing the biggest pullback in consumer demand. Advanced Retail Sales: Electronics and Appliance Stores and Furniture and Home Furnishing Stores are down 4.4 percent and 3.2 percent from a year ago ending in November.
As macroeconomic indicators point toward consumer pullback, Black Friday and Cyber Monday sales defy expectations. Here’s a look at this years numbers:
$11.3 billion was spent by consumers on Cyber Monday
5.3 percent increase year-over-year
17.1 percentyear-over-year ‘in-store’ shoppers
8 percent increase in average spend per person
The state of consumer demand is in limbo. Is it descending or is consumption shifting to value-driven commodities?
“Pocketbooks are stretched,” he said. “People have less discretionary income or less disposable income to spend on things — and so they’re looking for value,” John Rainey, Chief Financial Officer at Walmart on Q3 earnings call.
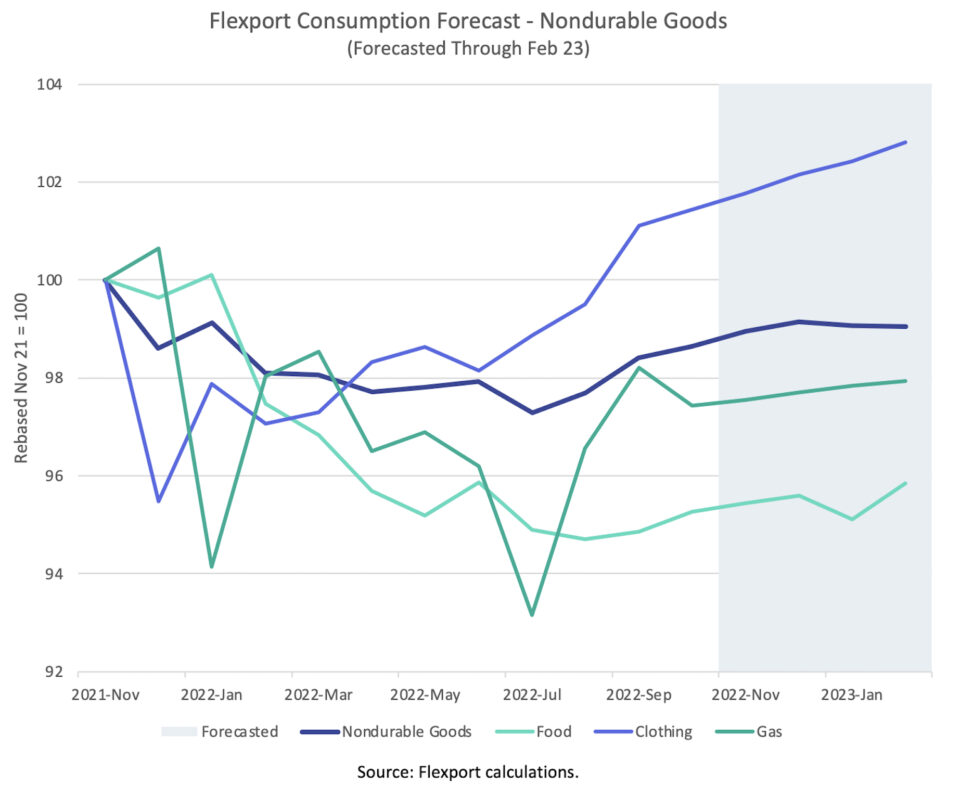
To potentially answer this question, Let’s take a look into the future withthe Flexport consumption forecast. A model developed by Flexport Research coupling government data on personal consumption expenditures and proprietary shipping data to forecast personal consumption four months out.
Flexport’s view on personal consumption
Phil Levy Chief Economist, Flexport
We all want to know what will happen with U.S. personal consumption as we embark on 2023. Beyond guessing, there are two main paths for applying some data and reasoning to the question. The first approach is to look at the big policy drivers of consumption and see what they portend. The second is to pay close attention to patterns and past correlations in consumption and see what these trends imply. As it happens, both approaches currently point in a similar direction: a fairly steady, elevated level of real, seasonally-adjusted personal consumption expenditures.
Let’s look at each approach in turn. The first, which we can call a structural approach, will focus on factors such as fiscal and monetary policy. In the first year and a half of the pandemic, fiscal policy consisted of a series of large federal programs that put money in the pockets of consumers. Those cash infusions correlated very well with spikes in goods spending. Monetary policy was just as stimulative, with negative real interest rates (a Fed Funds rate below the rate of inflation) and a rapidly-expanding Fed balance sheet (buying up bonds). These policies led to a large spike in spending on both durable and non-durable goods that peaked in the Spring of 2021.
Until very recently, fiscal policy had gone quiet. That changed a bit with the FY2023 Omnibus at the end of December, which was estimated to include a 3 percent real increase in non-emergency budget authority.
On the monetary policy front, the Federal Reserve has been hiking its policy rate significantly and starting to contract its balance sheet. While each move has drawn excited headlines, the Fed Funds rate is still below the rate of inflation and the balance sheet remains large. Taken together, these seem like a recipe for holding steady with levels of goods consumption that are well above pre-pandemic levels, but down from their peak.
The approach we take with the Flexport Consumption Forecast takes a different route to a similar conclusion. One advantage of looking carefully at trends and correlates is that it lets us provide a much more detailed, disaggregated take on what will be happening with consumption.
There’s interesting information in that detail. While our aggregate forecasts for personal consumption and the key components of durable and nondurable goods consumption hold fairly steady for the next few months, there is a lot of variation in the subcomponents, such as autos, household goods, and recreational goods (the latter two being notably more relevant for warehouse considerations). Measured relative to November 2021, as shown in the graph, household goods stayed flat, autos were marginally better, and recreational goods should continue to show significant growth. Durable goods as a category end up growing by about 3 percent.
The bottom line is that, over the near term, there’s little to suggest a dramatic spike or decline in personal consumption levels. A flat forecast may be unexciting, but it does mean that goods will keep moving in and out of warehouses.
C.H. Robinson’s view on the LTL market
Steve Raetz Director of Research and Market Intelligence, C.H. Robinson
We turn to industry leader, C.H. Robinson, for insights on the LTL freight market. Similar to other aspects of the supply chain, the LTL market is facing capacity and labor constraints. The rising cost of capital is one of the main reasons limiting LTL capacity expansion.
“The years of 2021/2022 were big for expansion of LTL capacity. In 2023, the focus will be on updating existing facilities to support expanded capacity.” – LTL freight carrier
Tonnage and capacity heatmap
Tonnage insights
Capacity insights (crossdock terminal capacity)
↓2019/2020
low-mid single digit declines Y/Y
↓ 2019/2020
1–2 percent capacity decrease each year
↑ 2021
9 percent increase Y/Y
— 2021
Flat capacity year
↓ 2022
Estimated -3 percent from 2021
↑ 2022
Estimated +2 percent from 2021
↓ 2023
Forecast: -3 percent from 2022
↑ 2023
Forecast: +1–2 percent from 2022
The table above suggests the possibility of capacity and tonnage/volume balancing as early as 2023. Here’s a few LTL insights when looking at the market from a long-term view:
Today there is 10% less terminal capacity than 2010
Of the 16 years from 2007 to 2022, 12 saw contracting or flat LTL capacity
+7.6 percent and +11 percent increase in tonnage and volume avg over 2009-2021
~2 percent growth in LTL capacity in 2022
Tonnage/shipments
Terminal growth/contraction
2007–2008
Largest LTL years
2007–2022
4 of 16 years expanded
+7.6 percent tonnage avg. over 2009-2021
12 of 16 years contracted/flat
+11 percent shipments avg. over 2009-2021
2010–2022
Terminal capacity decreased ~10 percent
2009–2021
Steady growth trend
Terminal capacity expansion estimated at ~2 percent in 2022
17 percent more tonnage in 2021 over 2009
10 percent more volume in 2021 over 2009
2006–2008 showed LTL spikes, 2009 was materially lower, with steady growth since
What to consider in 2023
All things considered, we expect LTL carriers to continue to with highly disciplined pricing with general rate increases around 5 percent, despite the decelerating tonnage and volume forecasts for 2023. Actual pricing budgets will be dependent on the freight attributes, carriers, and modal strategies employed. Some lanes will take larger increases, while others may offer some savings. With an LTL market that will continue a very disciplined approach to freight selection and pricing, use these questions to reflect on your LTL strategy and budgeting:
Are shipment accessorial charges for lift gates, appointments, and extra charges for some pick/delivery areas after the shipment event?
Does my capacity strategy reflect the needed diversification of today’s LTL market?
Do I have distinct strategies for my regional and national freight?
Am I offering a quality driver experience with quicker access to dock resources, shorter dwell time, and the opportunity to be on the loading dock?
If the answer to one or more of these questions is “no,” consider optimizing your shipping strategy for the year ahead. The results can help ensure your portfolio of LTL freight has the most sustainable strategy for price and service.
Pauncefote and Hay’s view on inventory decision-making
Chris Rogers Supply Chain Analyst, Pauncefote and Hay
As retail sales start to trend downwards, supply chain decision-makers have to decide not just how much they want to keep in stock, but also where they source from and where they store it. As we enter 2023, a combination of three short and long-term factors are at play in driving inventory decision-making. Here we take the example of furniture retailers.
In the short-term, supply chain planners are simply making a decision on volumes. The inventory-to-sales ratio for U.S. furniture stores reached 1.58x in October 2022, down from a peak of 1.71x in June and a trough of 1.25x in January 2021. The October level is in line with the average from 2016-2018, indicating the rebalancing process may be done.
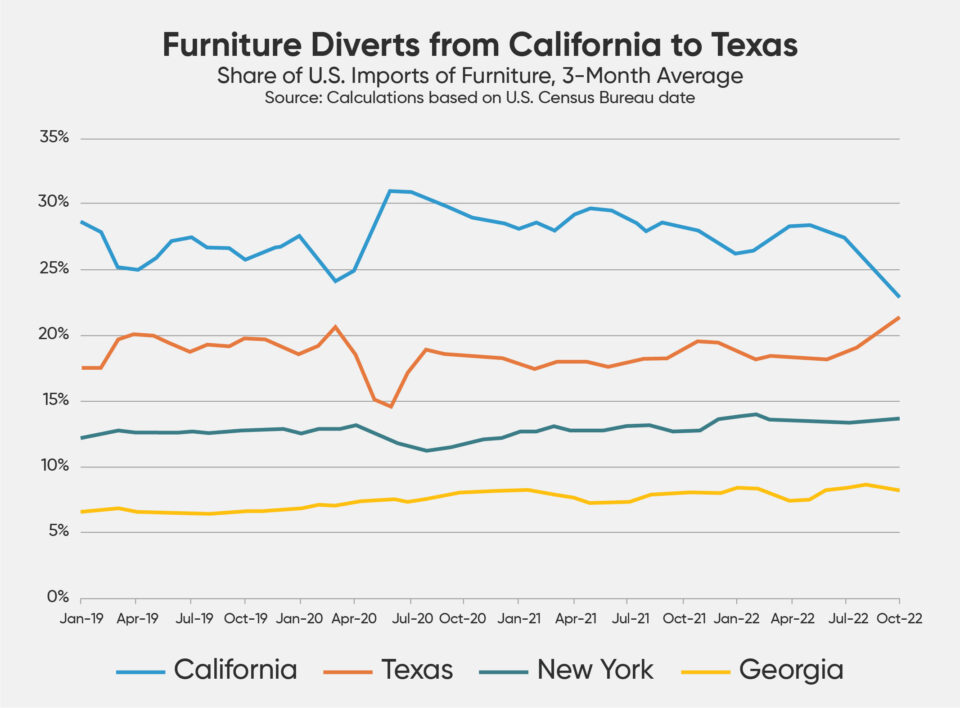
Yet, as we enter a recession in 2023, the cost of sourcing matters as firms seek to maintain profitability. The location of sourcing, i.e. reshoring strategies, may become more important. On top of cost, the origin choices have risk factors to consider. Imports of furniture from China, for example, are subject to Section 301 duties that were applied by the previous and continued with the current administration. Production in China has also been disrupted in 2022 by the pandemic. China’s share of U.S. furniture imports fell to 36 percent in the 12 months to Oct. 31, 2022, down from 50 percent in 2016, according to U.S. Census Bureau data.
Third, and of most relevance to the warehousing decision, is where imported goods are delivered to. A shift from shipping into the west coast to the east coast in aggregate is well documented. It is also possible to see, again using U.S. Census Bureau data, which states furniture is being shipped to.
The chart above shows the precipitous drop in the share of imports of furniture into California. In the three months to Oct. 31, 2022, they were 22.8 percent of the national total. That was down from 28.4 percent at the same time a year earlier. Shipments into Texas meanwhile reached 21.3 percent from 18.8 percent. The decline in shipments to California may reflect a combination of congestion avoidance, lower shipments from China specifically as well as regional demand requirements from retailers.
Ultimately though, it’s money that will win the day rather than theory. In a lower-demand environment, shareholders may demand lower inventories and the least cost, rather than a lower risk-cost balance, approach to inventories and sourcing to maximize profits.
Warehouse Pricing Index
Data methodology
The Warehouse Pricing Index (WPI) is powered by service fees across our global network for ambient warehousing. We’ve started by defining a baseline of 100 in Q1’ 2021 and looking at changes in costs relative to the average price of the service (storage, pallet-in, and pallet-out costs) and filtering out the upper and lower 5 percent percentiles. Market insights are obtained through interviews with partners from within our agile warehouse network.
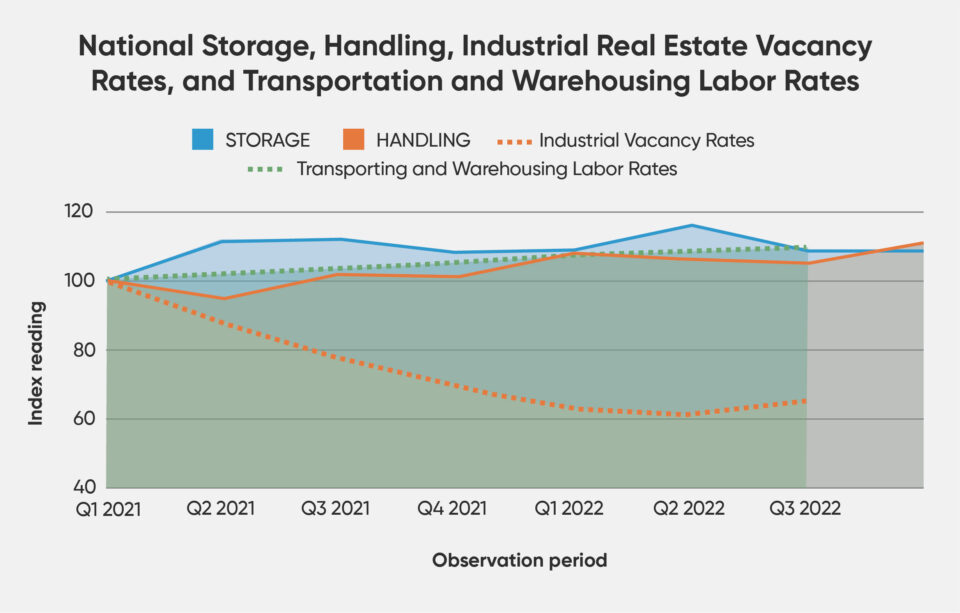
National warehouse storage rates remain elevated but unchanged (-/+%) in Q4’22 versus Q3’22 at an index reading of 109. At a regional level, the 3-quarter rolling average shows Northeast with the highest percentage increase at 12 percent relative to the baseline of Q1′ 2022. The Midwest and West Coast regions also saw increases of 8 and 7 percent, respectively.
Looking ahead in 2023, WarehouseQuote expects warehouse storage pricing to steadily increase as industrial real estate rents and labor rises, vacancy rates remain below historical averages, and new warehousing capacity entering the market slows down due to the rising cost of capital and current economic conditions.
An interesting development that WarehouseQuote will be closely watching is the diversion of trade. In Q3 and Q4 2022, supply chain managers diverted containers from the West Coast to East Coast to avoid potential supply chain disruptions. This increase in port traffic also led to an increase in warehouse pricing in the Northeast region.
CNBC recently surveyed 341 logistics managers from the National Retail Federation, The American Apparel and Footwear Association, The Council of Supply Chain Management Professionals, the Pacific Coast Council, the Agriculture Transportation Coalition and the Coalition Of New England Companies For Trade.
Of those surveyed, 49 percent said they did not divert trade, compared to 40 percent said they did. The ILWU strike threat, AB5, and rail delays were cited as the main reasons for moving trade from the West coast.
Conclusion
This year’s peak season numbers prove that both consumer demand and behavior is unpredictable. Furthermore, ongoing supply chain disruptions and rising costs justify the need for agile and resilient logistics networks.
With that being said, here are WarehouseQuote’s top 4 inventory management strategies to consider in 2023:
Forward stocking locations to mitigate ongoing supply chain disruptions
Rising costs and ongoing supply chain disruptions continue to be a concern for middle market businesses. Adding distribution nodes can position inventory closer to customers mitigating risk, lowering costs, and improving customer experiences.
Port markets will remain tight, look inland
Warehousing capacity constraints will continue for the foreseeable future. This will cause storage and handling rates to ascend in key port markets like Los Angeles, The Inland Empire, and New York/Newark. We recommend looking into secondary and tertiary markets like Reno, Las Vegas, and Phoenix for more cost-efficient storage rates.
Small-to-medium-sized business should consider inventory consolidation
WarehouseQuote is continuing to see the trend of small-to-medium-sized businesses being removed from warehouses who instead are becoming more interested in larger, dedicated customers. We recommend re-evaluating your warehouse network at the beginning of 2023 and consider the idea of inventory consolidation to mitigate risk.
Voice of the warehouse
“Tight industrial real estate vacancy rates have driven up real estate costs in the key markets. As we have explored additional capacity, the price per square foot has doubled over the past 2 years. These drivers will be heavily influencing storage rates heading into 2023”
“As we have continued to grow, technology has been a major challenge for us.”
“The labor market is still unpredictable. We have raised our pay rates to be equivalent to our competitors; however, the consistency and motivation has declined dramatically.”
“We are still feeling heavy after-effects of COVID-19 and its influence on the labor market. Less people are willing to work warehousing jobs as employers move to a work-from-home model which has created a strong demand for labor, driving prices up.”
“Smaller companies who have created recent partnerships with 3PL’s may decide to go back to in-house fulfillment or find other ways to ship their products without the use of a 3PL.”
Explanation of terms
Flexport consumption forecast
Flexport’s Consumption Forecast (FCF) shows the outlook for real (i.e. inflation-adjusted) Personal Consumption Expenditures on a seasonally adjusted basis.
Industrial real estate vacancy rates
Industrial real estate vacancy rate is the percentage of available industrial property, such as a warehouse or distribution center.
Retail inventories
Merchandise inventories are the value of stocks of goods held for sale. The inventories estimates represent the value, at cost, of the merchandise available for sale as of the last day of the report period. Methods of valuation may vary according to the accounting practices of each firm. The estimates provided in this report are valued on a non-LIFO (last in, first out) basis. Note — LIFO is a method of valuing inventory where the latest items of merchandise added to the inventory are the first ones taken out. Non-LIFO would mean that another method, such as FIFO (first in, first out), was used to establish the value of the inventory available for sale. Merchandise inventories are shown for stores and warehouses servicing retail establishments. Included are only those warehouses that maintained supplies of merchandise primarily intended for distribution within the organization.
Retail inventories/sales ratio
The inventories / sales ratios show the relationship of the end-of-month values of inventory to the monthly sales. These ratios can be looked at as indications of the number of months of inventory that are on hand in relation to the sales for a month. For example, a ratio of 2.5 would indicate that the retail stores have enough merchandise on hand to cover two and a half months of sales.
Retail sales
The Advance Monthly Sales for Retail and Food Services provides early estimates of monthly sales for companies in the retail trade and food services sectors.
WarehouseQuote’s economic commentary disclaimer
The material and content used in this publication is for informational purposes only. Reference to any third party (including external hyperlinks) does not constitute or imply the endorsement of said third party. WarehouseQuote does not warrant the accuracy or completeness of the Content. The views and opinions expressed herein are those of the author and do not necessarily reflect the official policy or position of WarehouseQuote. Reproduction of the Content may be made only with the written permission from WarehouseQuote.
Flexport disclaimer
The contents of this report are made available for informational purposes only and should not be relied upon for any legal, business, or financial decisions. Flexport does not guarantee, represent, or warrant any of the contents of this report because they are based on our current beliefs, expectations, and assumptions, about which there can be no assurance due to various anticipated and unanticipated events that may occur. This report has been prepared to the best of our knowledge and research; however, the information presented herein may not reflect the most current regulatory or industry developments. Neither Flexport nor its advisors or affiliates shall be liable for any losses that arise in any way due to the reliance on the contents contained in this report.
Jon Poehnelt Chief Commercial Officer, Steam Logistics
Steve Raetz Director of Research and Market Intelligence, C.H. Robinson
Chris Rogers Head of Supply Chain Research, S&P Global Market Intelligence
Jacob Roseburrough Director of Marketing
About WarehouseQuote
WarehouseQuote is a managed warehousing solution helping middle market and enterprise businesses scale their warehouse operations with precision. Through our 3PL warehousing and fulfillment network of 250+ facilities, integrated technology platform, and in-house supply chain expertise, we enable businesses to design efficient fulfillment networks connected by a single technology platform. Hundreds of B2B and B2C businesses like Chatime, Joyride, Benitago Group, Big Ass Fans, and Mighty Good Solutions use WarehouseQuote to scale, streamline, and optimize their warehouse operations.