Industrial vacancy rates rise. Warehouse services pricing remains flat. U.S. east coast container shipping rates soar. Inventories normalize. New disruptions arise.
Jacob Roseburrough Director of Marketing
Executive Summary
3.0 percentincrease in the national average of warehouse storage costs year-over-year Q4’22 vs Q4’23, with stagnant quarter-over-quarter cost growth
Warehouse storage costs remain resilient, even as inventories drop across the US
The Midwest region led the U.S with a 7.5 percent increase from Q4’22 to Q4’23
RSM’s Q4’23 Middle Market Business Index (MMBI) signals strong expansion and productivity of the U.S. economy, up2.6 percentage points from Q3’23
Container shipping rates from North Asia to the US East Coast rose to $6,200 per FEU as of Jan. 4, 2023 from $2,150 per FEU in early October, S&P Global Commodity Insights data shows
The Warehouse Pricing Index is now available in Journal of Commerce’s extensive, multi-channel dashboard, Gateway. Learn more about the Gateway and how WarehouseQuote is helping supply chain managers make confident supply chain decisions.
Industrial vacancy rates rise. Warehouse services pricing remains flat. U.S. east coast container shipping rates soar. Inventories normalize. New disruptions arise.
The year 2024 is off to a fast start. The Suez Canal and Red Sea disruptions are causing ripple effects across the global supply chain and forcing shippers of all sizes to resort to contingency plans to get inventory into the states.
Industrial real estate vacancy rates hit 5.2%, marking the highest vacancy rate in the last 3 years but still remains below the pre-pandemic average. Retail inventories have returned to normal levels and appear that the majority of businesses have reverted back to the just-in-time inventory (JIT) approach. Warehouse services pricing has seen marginal increases but is expected to rise throughout the year as a large subset of industrial leases are set to expire in the next 18 months. Though inventories continue to trend downward, costs to lease warehousing space continue to rise, which led to historically similar general rate increases to round-out 2024. With the upward pressure expected to continue, this is an opportunistic time for businesses to take a holistic approach to re-evaluating their warehousing, fulfillment, and distribution strategies to lock-in attractive rates and develop custom solutions to support future business growth.
If your organization is exploring new warehousing and fulfillment models within the next 12 months, reach out to WarehouseQuote. Our consultative and data-driven approach can help your business determine the warehousing and fulfillment solution that best fits your business needs.
We have now seen Inventory Levels decline in 7 of the last 8 months, according to the LMI
4.7% Year-over-increase in the Average Hourly Earnings of Warehousing Employees
National Warehouse Pricing Index
The national warehouse pricing index (WPI) reading remained stagnant in Q4'23 vs Q3’23 as capacity across the U.S. tightened due to a moderate demand surge for retail peak season inventory overflow. The national WPI shows a slight year-over-year increase in the price of warehouse storage compared to U.S. Bureau of Labor Statistics at 3 and 5 percent year-over-year increases.
WarehouseQuote expects U.S. 3PL warehousing capacity to be in a state of expansion throughout 2024. We’ve illustrated the impact of key macro trends to the supply and demand of U.S 3PL Warehousing in the table below.
U.S. Supply Chain Trends
Supply
Demand
Annotations
Retail Inventory to sales ratios reach pre-pandemic levels
Inventory efficiencies typically lead to less inventory on hand and utilization of warehouse space.
U.S. Manufacturing New Orders activity remains in contraction state
Lower manufacturing activity typically leads to less upstream warehousing activity.
The increase in the U.S. West Coast port usage due to Suez Canal and Red Coast supply chain disruptions
-
-
The shift in maritime transportation strategy from the U.S. east coast to west coast could contribute to demand and pricing pressures.
Regional Warehouse Pricing Index
The Midwest region leads all regions with an 8 percent year-over-year increase in warehouse storage pricing. The Northeast, West, and South region warehouse storage pricing remains elevated but has flatlined over the last four quarters. WarehouseQuote expects continued upward pressure on storage in the West due to increased demand as a result of militant actions in the Red Sea.
The voice of WarehouseQuote
“As your business continues to grow, never underestimate the power of having a truly talented team in your corner. Your people & the partnerships you form can make all of the difference.” - Paul Harris, VP Operations at WarehouseQuote
Exclusive commentary from S&P Global Market Intelligence and C.H. Robinson
Finding a better way: Fall-out from canal shipping disruptions
Chris Rogers Head of Supply Chain Research, S&P Global Market Intelligence
Supply chains are truly global. Military actions against shipping in the Red Sea could affect the balance of demand for warehousing space between the US east and west coasts heading into the 2024 peak shipping season. S&P Global Market Intelligence’s data shows the shift in US import balances has already begun.
Violence in the Red Sea continues to compromise shipping via the Strait of Bab al-Mandab and the Suez Canal and the supply chains that rely on them. The situation is proving to be highly dynamic, making logistics planning for supply chain managers increasingly complex.
The diversion of container shipping away from the Suez Canal had already started in early December, S&P Global’s Maritime Intelligence Risk Suite data shows. The proportion of westward sailings from Asia to Europe routing via Suez was 78% between Oct. 7, 2023 and Nov. 30. It then fell to 68% in the period to Dec. 20 and finally fell to 15% in the last week of 2023 and below 5% currently.
Shipping via the Suez Canal was a secondary option for liners looking to reduce their exposure to the Panama Canal.
The length of time to ship from Asia to the US East Coast via Panama or via Suez depends on the overall service string (i.e. number of interim ports), but typically adds 10 days to 15 days to sailings.
The impact on disruptions has been global. Container shipping rates from North Asia to the US East Coast rose to $6,200 per FEU as of Jan. 4, 2023 from $2,150 per FEU in early October, S&P Global Commodity Insights data shows.
Other shipping options for East Coast Americas / Asia supply chains may prove more practical, but involve a different range of risks and could lead to higher costs too: Shipping from Asia to the US west coast and then using rail or truck transportation may be limited in terms of capacity during the peak shipping season, as demonstrated during the pandemic when excessive consumer goods shipments led to diversions to the US east coast ports from the west.
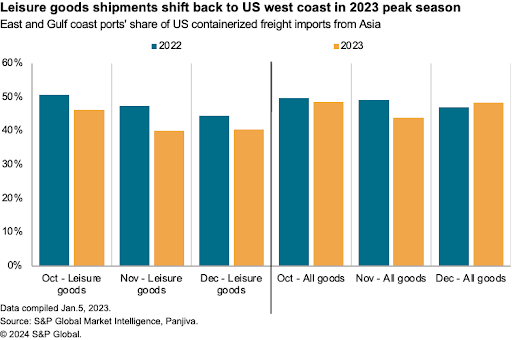
An apparent preference for US west coast ports has already emerged once more. S&P Global Panjiva data shows US seaborne imports of leisure goods (toys and fitness equipment) headed to east coast ports fell to 40.5% of the total in December 2023 from 44.5% a year earlier.
Shipments from Asia by sea to the US east coast – which will require shipments either via the Panama Canal, the Suez Canal or the Cape of Good Hope – accounted for 64% of all imports by sea to the US east coast (the rest being from the Atlantic Basin or Latin America), S&P Global Market Intelligence data shows.
The short-term impact on the consumer goods sector is mitigated by seasonality, with a larger slice of annual imports arriving in the third quarter ahead of the peak shipping season. There’s nonetheless a high exposure in consumer goods including toys (77%), apparel (58%) and vacuum cleaners and kitchen devices (52%.)
A switch back to US west coast ports from the east coast may alter the distribution of warehousing space required, particularly if retailers choose to preload their supply chains earlier than normal for peak season, if the disruptions continue later into 2024.
Mathew Leo Principal Manager, Research and Market Intelligence, C.H. Robinson
LTL environment | Tonnage remains weak but pricing is strong
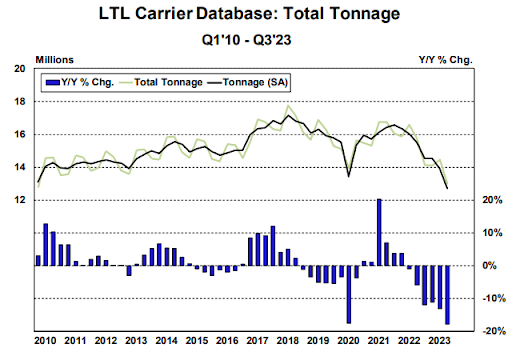
LTL tonnage has broadly been decreasing since 2022 from a Y/Y change perspective, as seen below in Figure 1. In the midst of this downturn, Yellow, the third largest LTL carrier, controlling approximately 9% of total industry revenue, ceased operations. This resulted in the reallocation of approximately 45k-60k shipments/day across the remaining carriers. Given the softer freight demand at the time, this transition was handled without much disruption to supply chains, as LTL carriers jockeyed to acquire market share.
Since then, however, carriers have been able to reassess their newly acquired freight and better determine what fits into their network and adjust accordingly. This has tipped the scales from an oversupplied market to arguably an undersupplied market, as the total terminals remaining are now limited. Despite approximately $2B worth of terminals already auctioned, and more to come, these terminals are not immediately active, as it will still take some time to finalize details and get each facility operational under the new management. This process will take several months and in some cases over a year to complete, so current conditions in the marketplace will persist in 2024, as pricing pressure will likely continue through the year and possibly into 2025. Due to market conditions and this shift, GRIs (General Rate Increases) have continued to be issued, several of them coming sooner than expected. This pricing pressure would be exacerbated if tonnage begins to increase and further tips the scales of supply and demand.
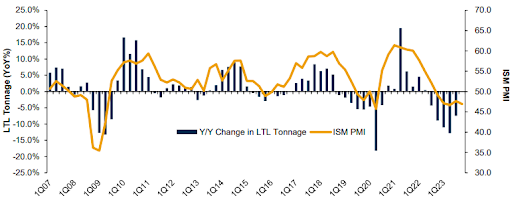
The Purchasing Managers Index (PMI) data released by the Institute for Supply Management (ISM) is a measurement used to reflect the health of the U.S. industrial economy and is released on a monthly basis. Despite the highest reading since September, the December result of 47.4% marks the 14th consecutive month contraction (below 50). This is the longest of such streaks since the downturn starting in the year 2000, lasting 18 months; even longer than the 12-month streak during the great recession in 2008-2009. As consumers continue to favor spending on services over goods, the PMI remains weak. There is a correlation between the PMI metric and LTL tonnage, as seen below in Figure 2, which makes this publicly available metric a popular one for shippers to monitor. When PMI and LTL tonnage turn positive, if we are still experiencing a constrained market due to limited terminal space, this could have a sharp impact on LTL pricing.
In partnership with the U.S. Chamber of Commerce, RSM has collected data on middle market firms since 2015 through quarterly surveys conducted by The Harris Poll. The RSM US Middle Market Business Index provides a leading measure on the performance of businesses that make up the heart and soul of our country's economy.
United States regional divisions
Midwest
East North Central: Illinois, Indiana, Michigan, Ohio, and Wisconsin
West North Central: Iowa, Kansas, Minnesota, Missouri, Nebraska, North Dakota, and South Dakota
Northeast
New England: Connecticut, Maine, Massachusetts, New Hampshire, Rhode Island, and Vermont
Middle Atlantic: New Jersey, New York, Pennsylvania
South
South Atlantic: Delaware, Florida, Georgia, Maryland, North Carolina, South Carolina, Virginia, Washington DC, and West Virginia
East South Central: Alabama, Kentucky, Mississippi, and Tennessee
West South Central: Arkansas, Louisiana, Oklahoma, and Texas
WarehouseQuote’s economic commentary disclaimer
The material and content used in this publication is for informational purposes only. Reference to any third party (including external hyperlinks) does not constitute or imply the endorsement of said third party. WarehouseQuote does not warrant the accuracy or completeness of the Content. The views and opinions expressed herein are those of the author and do not necessarily reflect the official policy or position of WarehouseQuote. Reproduction of the Content may be made only with the written permission from WarehouseQuote.
Chris Rogers Head of Supply Chain Research, S&P Global Market Intelligence
Mathew Leo Principal Manager, Research and Market Intelligence, C.H. Robinson
About WarehouseQuote
WarehouseQuote is a managed warehousing solution helping middle market and enterprise businesses scale their warehouse operations with precision. Through our 3PL warehousing and fulfillment network of 250+ facilities, integrated technology platform, and in-house supply chain expertise, we enable businesses to design efficient fulfillment networks connected by a single technology platform. Hundreds of B2B and B2C businesses like Chatime, Joyride, Benitago Group, Big Ass Fans, and Mighty Good Solutions use WarehouseQuote to scale, streamline, and optimize their warehouse operations.