
Q4'26 Warehouse Pricing Index Report

EXECUTIVE SUMMARY
- The National Warehouse Pricing Index increased 0.4 percent in Q3'26 to 112.2, its first quarterly gain after three straight declines.
- Preliminary S&P Global data shows U.S. seaborne imports of containerized freight rose 14% year over year in October, a third straight monthly gain, even as supplier delivery times slowed to their worst level since July 2022.
- The truckload market is projected to move from its expansion phase into its peak phase in December, and with diesel entering Q4 at a record high, transportation costs are expected to stay elevated into 2027.
The Warehouse Pricing Index (WPI) is available in the Journal of Commerce’s extensive, multi-channel dashboard, Gateway. Learn more about Gateway and how WarehouseQuote helps logistics managers make informed supply chain decisions.
The Index Turns
After three straight quarterly declines, the National Warehouse Pricing Index moved up in Q3, rising 0.4 percent to 112.2. It’s a small move, but the direction matters. The index has risen every month since May, and the gains picked up through July, August and September. National pricing is still slightly below where it was a year ago, so the turn is still early.
The conditions behind it are lining up. Industrial vacancy fell to 6.8 percent in Q3, according to Cushman & Wakefield. However, warehousing employment shrank three months in a row through September. Shippers are also bringing in inventory ahead of the holidays, so more freight is landing in buildings with fewer warehouse employees to handle it. Our advice from last quarter still stands, with one addition: commit to your network now, and build elasticity for potential shifts as market conditions change. As uncertainty remains consistent, this creates an opportunity to help shippers optimize inventory placement, control transportation costs, and build more flexible distribution networks.
U.S. Warehouse Market Watch
- 6.8% National Industrial Vacancy Rate (-0.1 percent)
- 112.2 National Warehouse Pricing Index Reading (+0.4 percent)
The West Breaks Out
The West led every region this quarter, climbing 1.5 percent to 106.4 and moving back above year-ago levels. Last quarter it was the region holding the national index back. This quarter it’s the one pulling it forward.
The Northeast Builds, the Midwest Holds
The Northeast kept climbing off its spring low, up 0.4 percent to 106.8. The Midwest barely moved, up 0.05 percent to 128.6, but it remains the highest-indexed region by a wide margin.
The South Slips
The South was the only region to decline, down 0.3 percent to 113.1, and sits 1.2 percent below a year ago. It’s now the softest region on a year-over-year basis.
What Does Normal Even Mean Anymore?

Congratulations, you’ve nearly made it through a 10th straight year of major supply chain disruptions! Now get ready for 2027 which is set to be the eleventh, but hopefully by now we all have visibility into the main risks and have gameplans for dealing with them as they develop.
For US-focused supply chains there’s no doubt that disruptions ranging from conflict in the Middle East and elevated fuel costs to trucking labor availability and global port strikes are having a knock-on effect to logistics operations. That can be seen in the S&P Global Purchasing Managers’ IndexTM (PMITM) measure of Supplier Delivery Times, which slowed to its worst in October since July 2022.
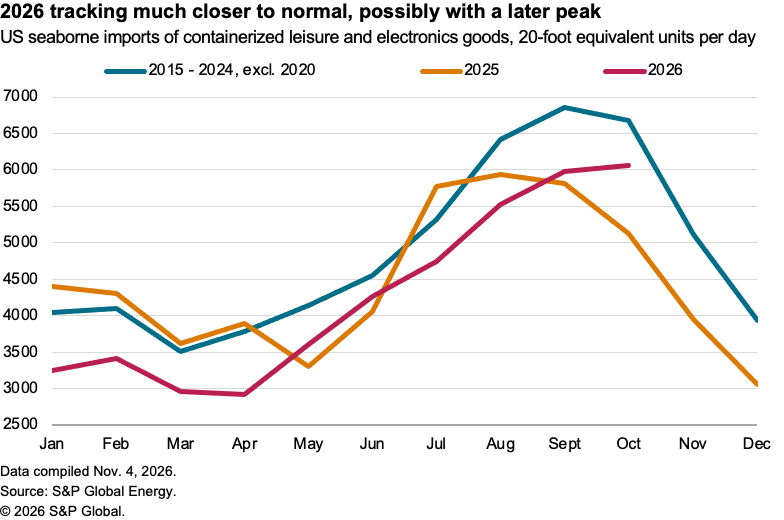
However, goods deliveries have continued apace. Preliminary S&P Global Energy data for October 2026 shows that US seaborne imports of containerized freight jumped by 14 percent year over year, marking a third straight month of improvements.
In that regard, tariff disruptions a year earlier clearly played their part, as they have in 2026 with the long-awaited Section 301 duties linked to manufacturing capacity in other countries yet to emerge. Tariff concerns haven’t been enough, however, to deter buyers from pursuing seasonal import patterns which appear close to normal. Imports in October of leisure goods and electronics were 1.2 percent higher than September, close to the 10-year average of a 1.6 percent dip and much closer to normal than the 11.9 percent drop seen in 2025.
Looking ahead though, 2027 will continue to be a year of tariff and wider trade policy uncertainty for US supply chain decision makers. At least until the next elections, tariff changes are part of the new normal. Aside from the Section 301 duties already mentioned, we’re watching for likely continued negotiations (rather than a resolution) for USMCA and further use of novel forms of tariff-setting including price floors, import bans and exceptions-in-return-for-investment.
Conflict is also sadly part of the new normal, with S&P Global Market Intelligence analysts expecting continued hostilities between the US and Iran on the 12-month view, leading to continued interruptions to energy products, petrochemicals and metals that are sourced via the Strait of Hormuz. Similarly, while container shipping is returning to the Suez Canal, further action in the region by the Houthis with targets in Saudi Arabia is likely.
The severity of El Nino remains an unanswered question with relevance for waterways globally. While rainfall has returned water levels in the Gatun Lake to more normal levels, reducing risks to shipping via the Panama Canal, river shipping across Europe and Latin America continues to be disrupted by low water levels. You don’t need to buy into climate change as a long-term trend to see that continuous weather-related disruptions to critical infrastructure are part of the new normal too.
Infrastructure construction also drove much of the boom in volumes, particularly for the products needed to build out artificial intelligence data centers: building materials, utility equipment, and the servers and communications equipment housed inside them. We expect growth to continue apace in 2027, with some risks to 2028 as more US states start to limit permitting for new data centers.
Finally, labor disruptions are also raising their head as a source of disruption in 2027 too, with new contracts and negotiations ongoing in Germany, Belgium and the Netherlands in Europe while the Canadian west coast ports have contracts coming up in Q1 2027 before the US west coast comes up once more in 2028.
There’s lots to watch, but we remain confident that logistics always finds a way, and will continue to do so in 2027, come what may!
Freight Market Pressures to Watch in Q4

The freight market in the fourth quarter of 2026 is expected to be shaped by two significant dynamics: the transition into the next phase of the truckload market cycle and continued pressure from elevated diesel fuel prices. These are far from the only factors affecting transportation, but both are important to understanding what shippers are experiencing and how those pressures may eventually flow downstream into inventory and warehousing decisions.
TL Market Cycle Transition
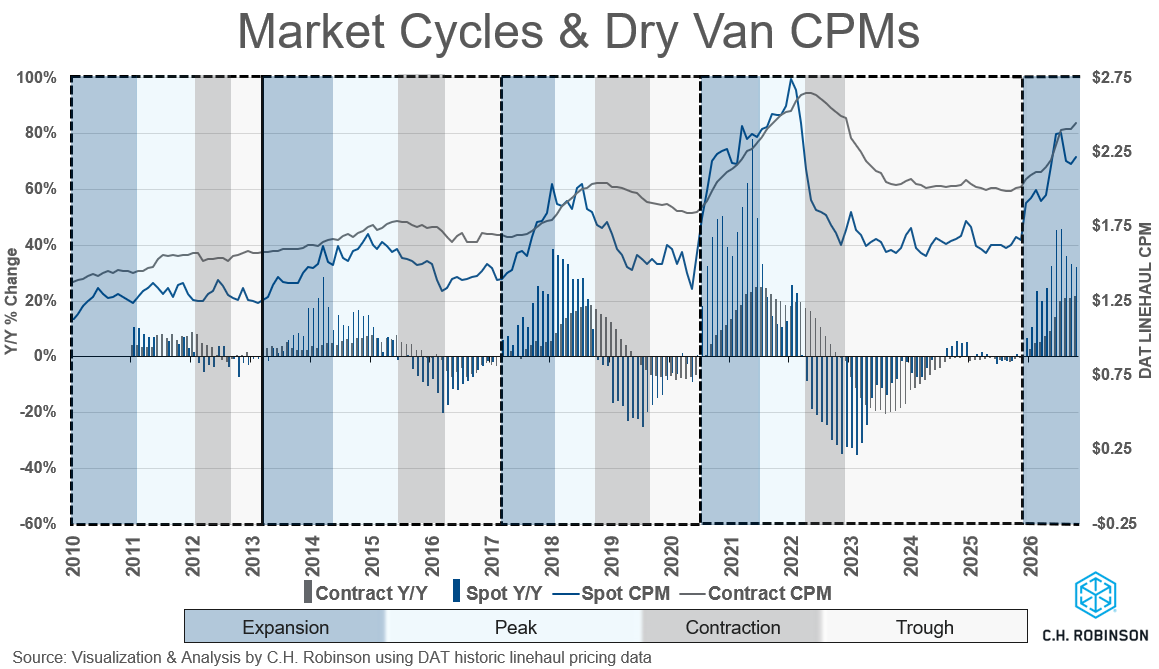
The truckload market is defined by four phases, as previously defined in a blog on Truckload Market Cycles based on recent academic research out of MIT’s Center for Transportation & Logistics, sponsored by C.H. Robinson. These phases are Expansion, Peak, Contraction, and Trough. During Expansion, spot and contract rates both increase year over year (y/y), with that growth accelerating. In the Peak phase, spot rates continue to increase y/y, but the pace of those increases begins to slow. Contraction begins when spot rates turn negative on a y/y basis, while contract rate growth slows or turns negative as well. Finally, during the Trough phase, rates remain negative y/y, but the declines become smaller as the market begins to flatten.
Currently, the U.S. truckload market is in the expansion phase of the market cycle, but nearing the end. Depending on the precise measure used for the spot market, y/y rate gains are nearing the point where they are starting to decelerate. November is expected to be the last month where the y/y change is greater than that of the previous month, which means that December 2026 is projected to be the first month within the peak phase. Phases tend to last 9-13 months, although outside forces can alter this, similar to how the large oversupply of carriers following the pandemic surge resulted in a 3-year trough period in 2023-2025. Holding all else equal, it is reasonable to expect 2027 to be predominantly in the peak phase, where spot rates continue increasing y/y but at a lesser magnitude. As transportation costs remain elevated throughout this part of the cycle, they will continue to influence mode selection, inventory positioning, and broader supply chain decisions.
Diesel Fuel Prices Elevated
The average national price of diesel in the U.S. entered Q4 2026 at a record high. Diesel prices have been rising faster than the price of the crude oil from which it’s made. This appears to stem less from crude oil supply and more from diesel-specific market fundamentals and refining costs. For U.S. freight transportation, the more immediate concern is often diesel pricing and distribution dynamics. Although widespread shortages have not emerged, isolated supply constraints and higher fuel costs are adding pressure across freight networks for carriers and shippers alike. For truckload carriers, approximately 16 percent of all miles driven are non-revenue generating miles, which means that increased fuel costs impact carriers’ costs as well as shippers’. Refrigerated carriers see additional stress as the trailers also consume fuel to maintain proper temperatures. Flatbed freight tends to also burn more fuel than a typical shipment, due to the less aerodynamic nature of the freight being hauled as well as the loss of highway fuel efficiencies for more rural, job-site deliveries.
Elevated fuel costs pressure carrier profitability and in some cases contribute to carriers exiting the market. This creates a dual challenge for shippers because not only do they have to pay higher fuel surcharges, they have to deal with a further constrained carrier pool. While 2026 is on pace to record the highest average annual diesel price in history, the U.S. Energy Information Administration is currently predicting 2027 to be the third highest, behind what was experienced in 2022. Shippers and carriers should plan for fuel to remain an important part of transportation budgeting and network planning into next year.
What This Means for Warehousing
Taken together, the freight cycle and elevated diesel costs point toward continued transportation cost pressure even as the market's rate of increase begins to moderate. For warehousing operations, the key is to consider transportation and inventory decisions together. Changes in freight costs, capacity, or mode can alter replenishment timing and inventory requirements well before those effects show up in warehouse utilization.
Explanation of Terms
Industrial Real Estate Vacancy Rates
Industrial real estate vacancy rate is the percentage of available industrial property, such as a warehouse or distribution center.
United States Regional Divisions
Midwest
- East North Central: Illinois, Indiana, Michigan, Ohio, and Wisconsin
- West North Central: Iowa, Kansas, Minnesota, Missouri, Nebraska, North Dakota, and South Dakota
Northeast
- New England: Connecticut, Maine, Massachusetts, New Hampshire, Rhode Island, and Vermont
- Middle Atlantic: New Jersey, New York, Pennsylvania
South
- South Atlantic: Delaware, Florida, Georgia, Maryland, North Carolina, South Carolina, Virginia, Washington DC, and West Virginia
- East South Central: Alabama, Kentucky, Mississippi, and Tennessee
- West South Central: Arkansas, Louisiana, Oklahoma, and Texas
WarehouseQuote’s Economic Commentary Disclaimer
The material and content used in this publication is for informational purposes only. Reference to any third party (including external hyperlinks) does not constitute or imply the endorsement of said third party. WarehouseQuote does not warrant the accuracy or completeness of the Content. The views and opinions expressed herein are those of the author and do not necessarily reflect the official policy or position of WarehouseQuote. Reproduction of the Content may be made only with the written permission from WarehouseQuote.
Sources
About WarehouseQuote
WarehouseQuote is a managed warehouse and fulfillment solution. Through operational expertise, purpose-built technology solutions, and an extensive warehouse and fulfillment network, we help businesses optimize their warehouse and fulfillment operations.
